


How Much Data Is Generated Every Day? - [Updated March 2026]
 12m, 13s
 2
11:00, 13.03.2026

Key findings:
- Global data volume expanded from 15.5 zettabytes in 2015 to 181 zettabytes by 2025, indicating an increase of 165.5 zettabytes over ten years.
- Annual data growth peaked at 56.6% in 2020, while growth rates from 2021 to 2025 stabilized within a narrow range of 22.5% to 23.7%, suggesting a shift from acceleration to sustained expansion.
- The amount of data generated per day rose from 5.48 million TB in 2010 to 495.89 million TB by 2025, representing more than a 90-fold increase in daily data creation.
- Per-capita data creation increased from 2.1 TB per person in 2015 to 22.1 TB per person in 2025, reflecting a more than tenfold rise in individual-level data generation.
- On a time-unit basis, global systems now generate approximately 29 TB per second, 1,736 TB per minute, and 2.5 million TB per day, highlighting the continuous nature of data creation.
- Global data generation infrastructure is highly concentrated, with the United States hosting 5,427 data centers, compared with 529 in Germany and 523 in the United Kingdom.
- Data creation is dominated by content-intensive activities, as video streaming and content account for 82% of total global data generation, while IoT and sensors contribute 8% and social media 4%.
Every online action leaves a digital trace, but the scale at which data is created globally is difficult to grasp without quantitative context. Emails, video streams, cloud applications, sensors, and enterprise systems continuously generate information that accumulates at increasing rates. Measuring this flow of data is essential for understanding how digital activity translates into global data volumes.
This article examines how much data is generated every day by placing daily figures within a broader historical and structural framework. Using year-by-year global data volumes, growth rates, and per-day estimates, it quantifies how global data creation has evolved and how quickly it continues to expand.
The analysis also breaks down data generation by time unit, per-person contribution, infrastructure distribution, and source categories. Together, these metrics provide a data-driven overview of how much information the world produces, how fast that volume is growing, and which systems and activities account for the largest share of global data creation.
To understand how much data is generated every day, it is first necessary to establish how much data is in the world in total and how this volume has changed over time.
Global data volume worldwide: How much data is in the world over time
The chart below shows the global data volume worldwide measured in zettabytes from 2015 to 2025. It reflects the total amount of data in the world, including data that is created, captured, copied, consumed, and stored globally. This time series provides a baseline for assessing how much data there is in the world before examining growth rates and daily data generation.
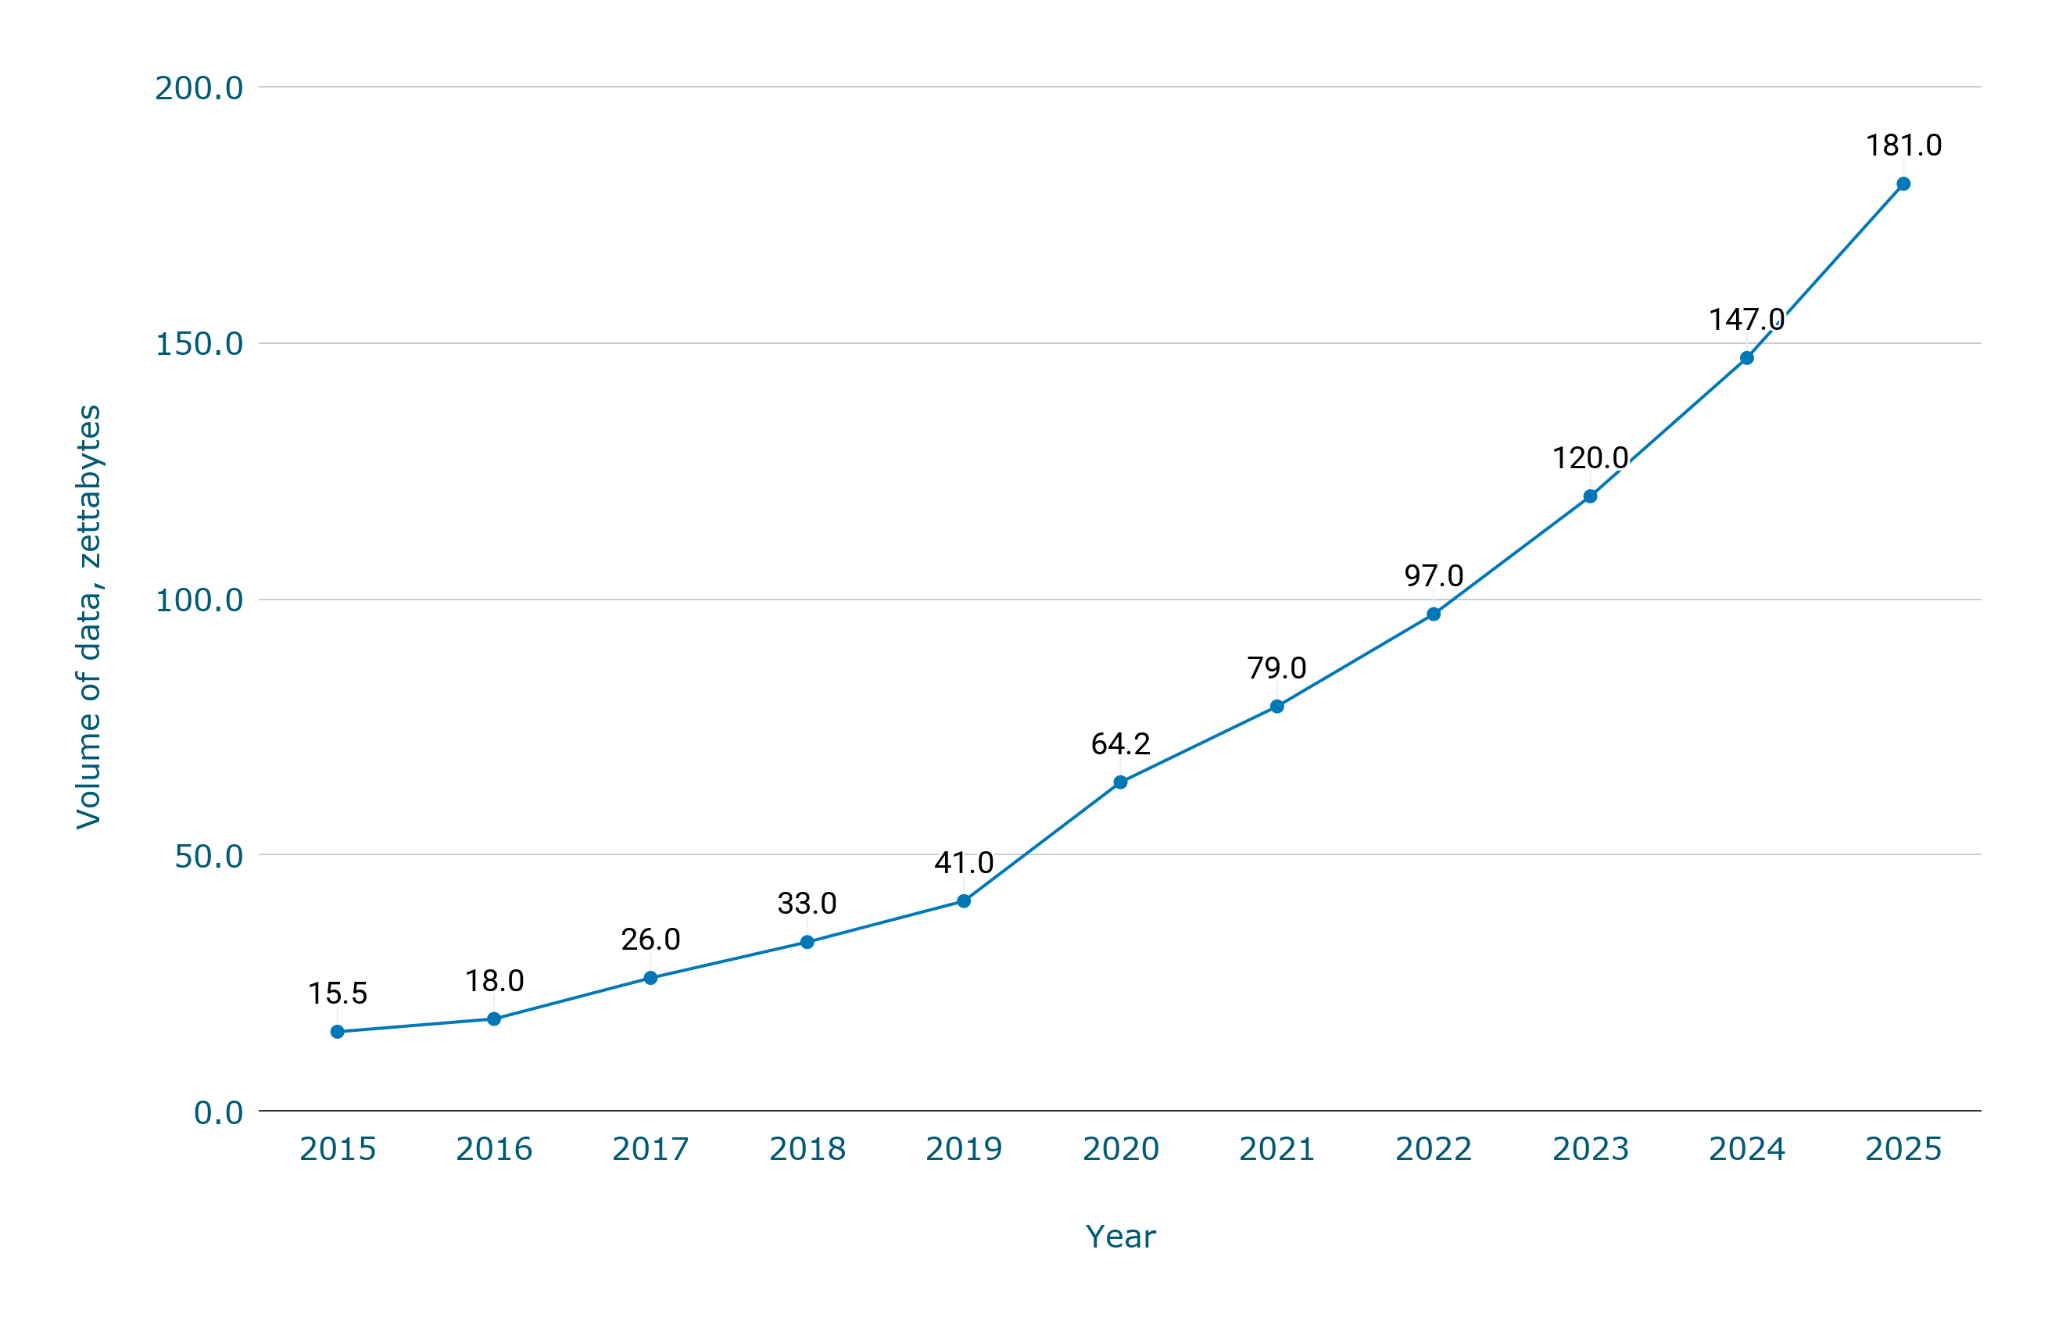
- The amount of data in the world increased from 15.5 zettabytes in 2015 to 64.2 zettabytes in 2020, representing more than a fourfold rise in five years.
- Global data volume reached 120 zettabytes in 2023 and is projected to grow further to 181 zettabytes by 2025.
- Between 2019 and 2025, the total data in the world expanded from 41 zettabytes to 181 zettabytes, an increase of 140 zettabytes.
Total amount of data in the world: Global data volume by year
| Year | Volume of data, zettabytes |
| 2015 | 15.5 |
| 2016 | 18.0 |
| 2017 | 26.0 |
| 2018 | 33.0 |
| 2019 | 41.0 |
| 2020 | 64.2 |
| 2021 | 79.0 |
| 2022 | 97.0 |
| 2023 | 120.0 |
| 2024 | 147.0 |
| 2025 | 181.0 |
The data shows a sustained and rapid expansion in the total amount of data in the world over the past decade. Global data volume has grown consistently each year, with particularly sharp increases after 2019. These figures establish the scale of global data accumulation and provide the quantitative foundation for analyzing how much data is generated every day in subsequent sections.
After establishing the total amount of data in the world, the next step is to examine how fast data is growing and how the pace of this growth has changed over time.
Growth rate of global data: How fast is data growing over time
The chart presents the annual data growth rate expressed as a percentage from 2015 to 2025. It illustrates how fast big data is growing each year by measuring changes in global data volume over time. This view makes it possible to assess whether the expansion of global data follows a stable pattern or reflects periods of accelerated growth.
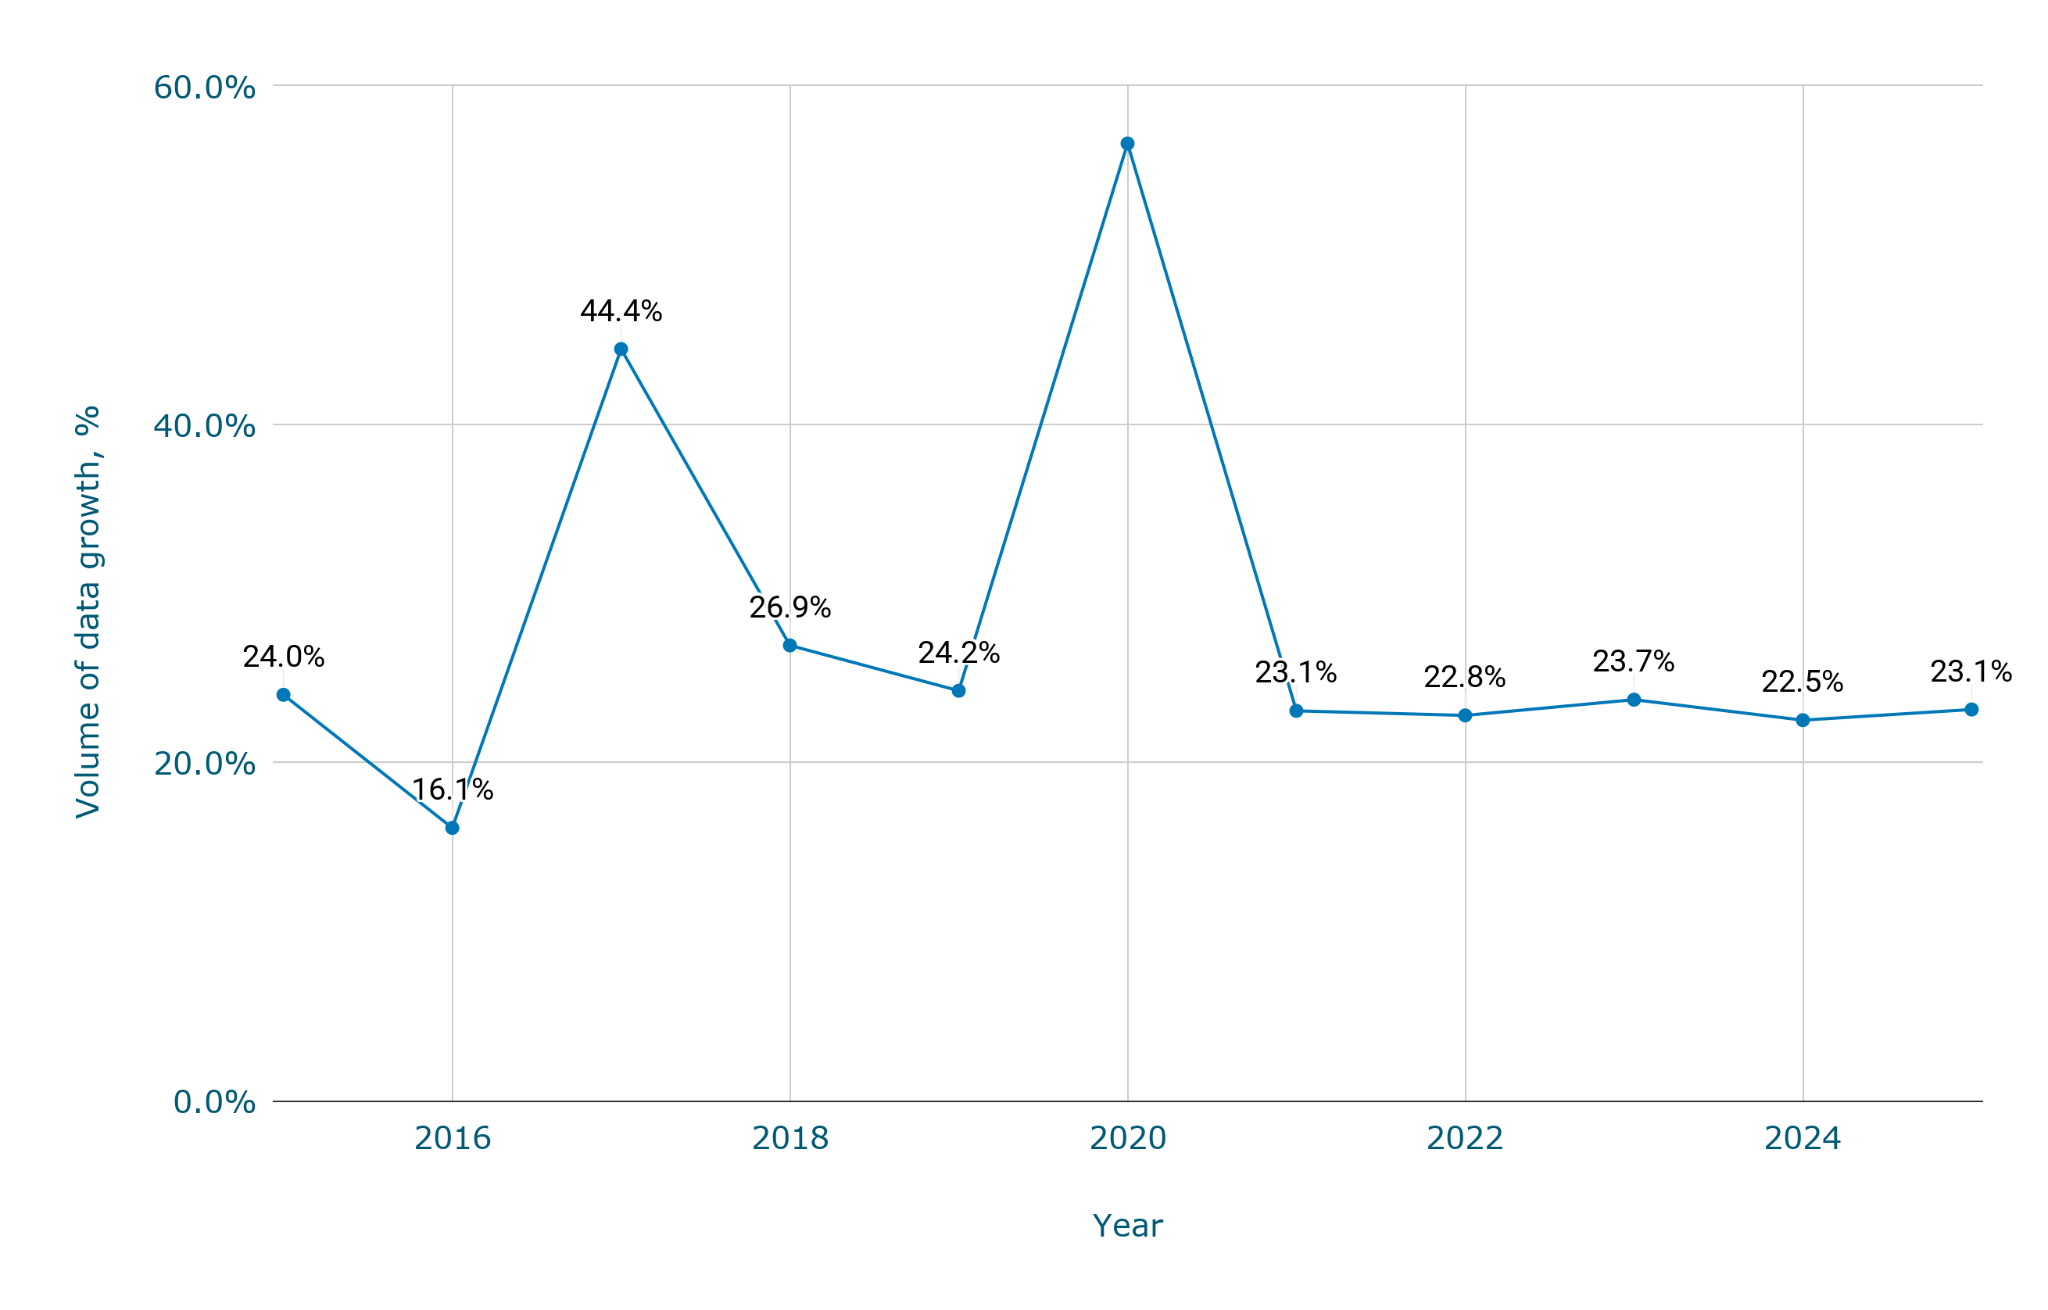
- The data growth rate peaked at 56.6% in 2020, the highest annual increase observed in the period shown.
- Annual growth slowed to 16.1% in 2016, which represents the lowest data growth rate in the dataset.
- From 2021 to 2025, data growth over time remained relatively stable, ranging between 22.5% and 23.7% per year.
How fast is Big Data growing? Annual data growth rate trends
| Year | Volume of data growth, % |
| 2015 | 24.0% |
| 2016 | 16.1% |
| 2017 | 44.4% |
| 2018 | 26.9% |
| 2019 | 24.2% |
| 2020 | 56.6% |
| 2021 | 23.1% |
| 2022 | 22.8% |
| 2023 | 23.7% |
| 2024 | 22.5% |
| 2025 | 23.1% |
The figures show that the expansion of global data is characterized by periods of acceleration rather than a constant linear trend. While the exponential growth of data is evident in certain years, particularly around 2020, growth rates in subsequent years stabilized at just above 20%. This pattern provides important context for understanding how fast data is growing before analyzing daily data generation levels.
While annual growth rates show how fast data is expanding, examining data generated per day provides a more granular view of how much new data is produced on an ongoing basis.
Daily data generation worldwide: How much data is generated every day
The chart illustrates the amount of data generated daily worldwide, measured in million terabytes, from 2010 to 2025. It shows how much data is generated every day as global data creation accelerates over time. This perspective helps quantify how much data is generated per day and how daily output has evolved across different years.
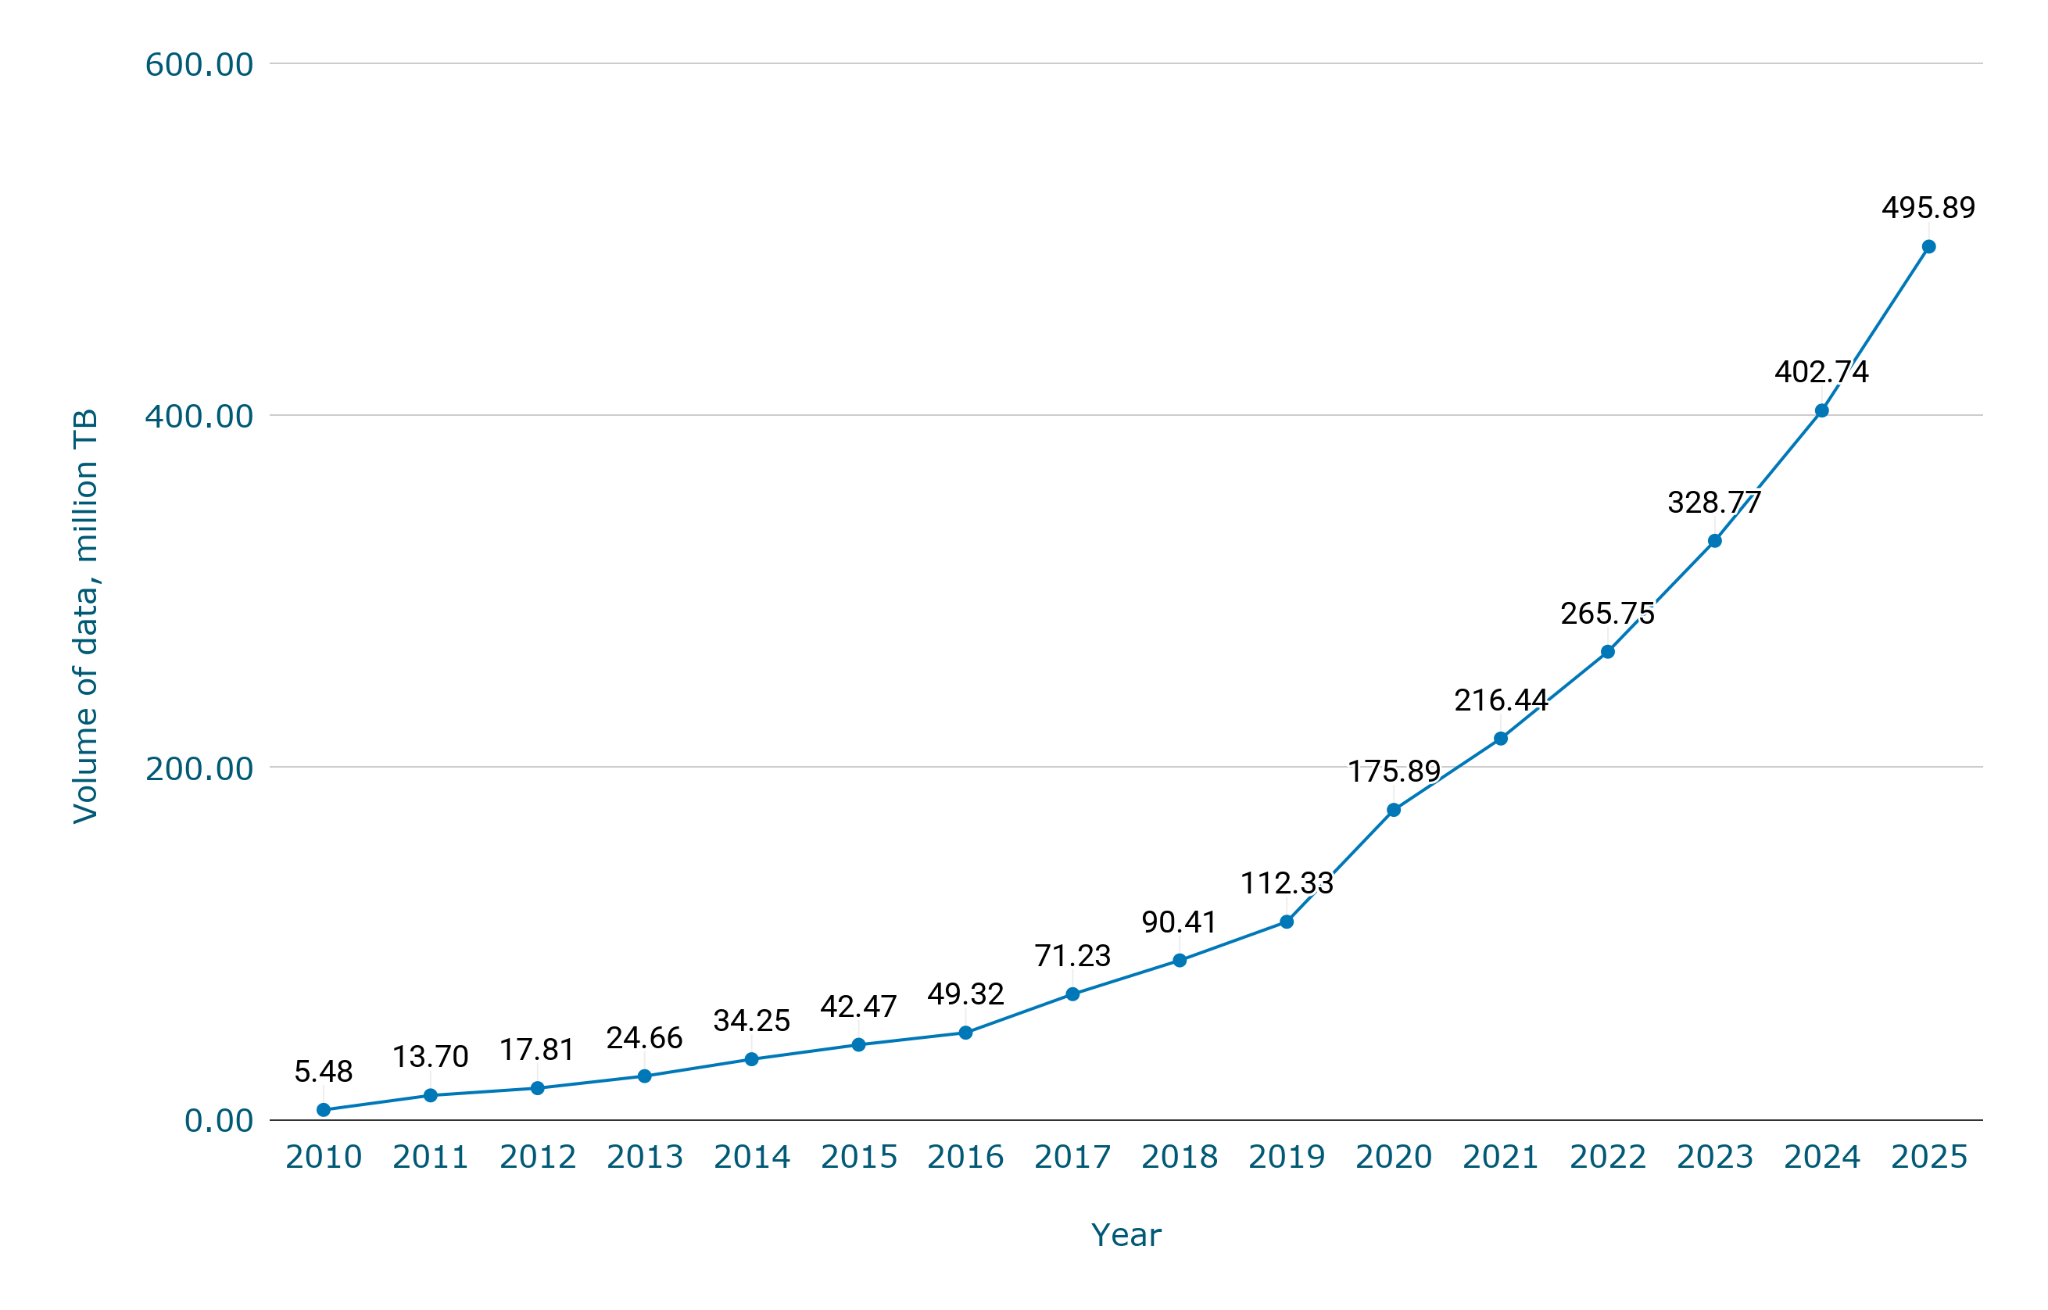
- The amount of data generated daily increased from 5.48 million TB in 2010 to 42.47 million TB in 2015, representing nearly an eightfold increase over five years.
- In 2020, daily data generation reached 175.89 million TB, compared with 112.33 million TB in 2019, indicating a year-over-year increase of 63.56 million TB per day.
- By 2025, the amount of data generated daily is projected to reach 495.89 million TB, which is more than 90 times higher than in 2010.
How much data is generated per day: Global daily data volumes over time
| Year | Volume of data, million TB |
| 2010 | 5.48 |
| 2011 | 13.70 |
| 2012 | 17.81 |
| 2013 | 24.66 |
| 2014 | 34.25 |
| 2015 | 42.47 |
| 2016 | 49.32 |
| 2017 | 71.23 |
| 2018 | 90.41 |
| 2019 | 112.33 |
| 2020 | 175.89 |
| 2021 | 216.44 |
| 2022 | 265.75 |
| 2023 | 328.77 |
| 2024 | 402.74 |
| 2025 | 495.89 |
The data shows a sustained rise in how much data is generated daily across the observed period. Growth in daily output has accelerated, particularly after 2019, reflecting broader increases in global digital activity. These figures provide a quantitative basis for assessing how much new data is generated every day and set the stage for examining per-person and time-based breakdowns in the following sections.
After examining how much data is generated per day at a global level, the next step is to translate these volumes into a per-person perspective.
Per-person data generation: How much data is created every day per person
The chart shows how much data is created every day per person, expressed in terabytes, from 2015 to 2025. It reflects the average data generated per day when total global data creation is distributed across the world’s population. This view helps contextualize daily global figures by focusing on individual-level data generation.
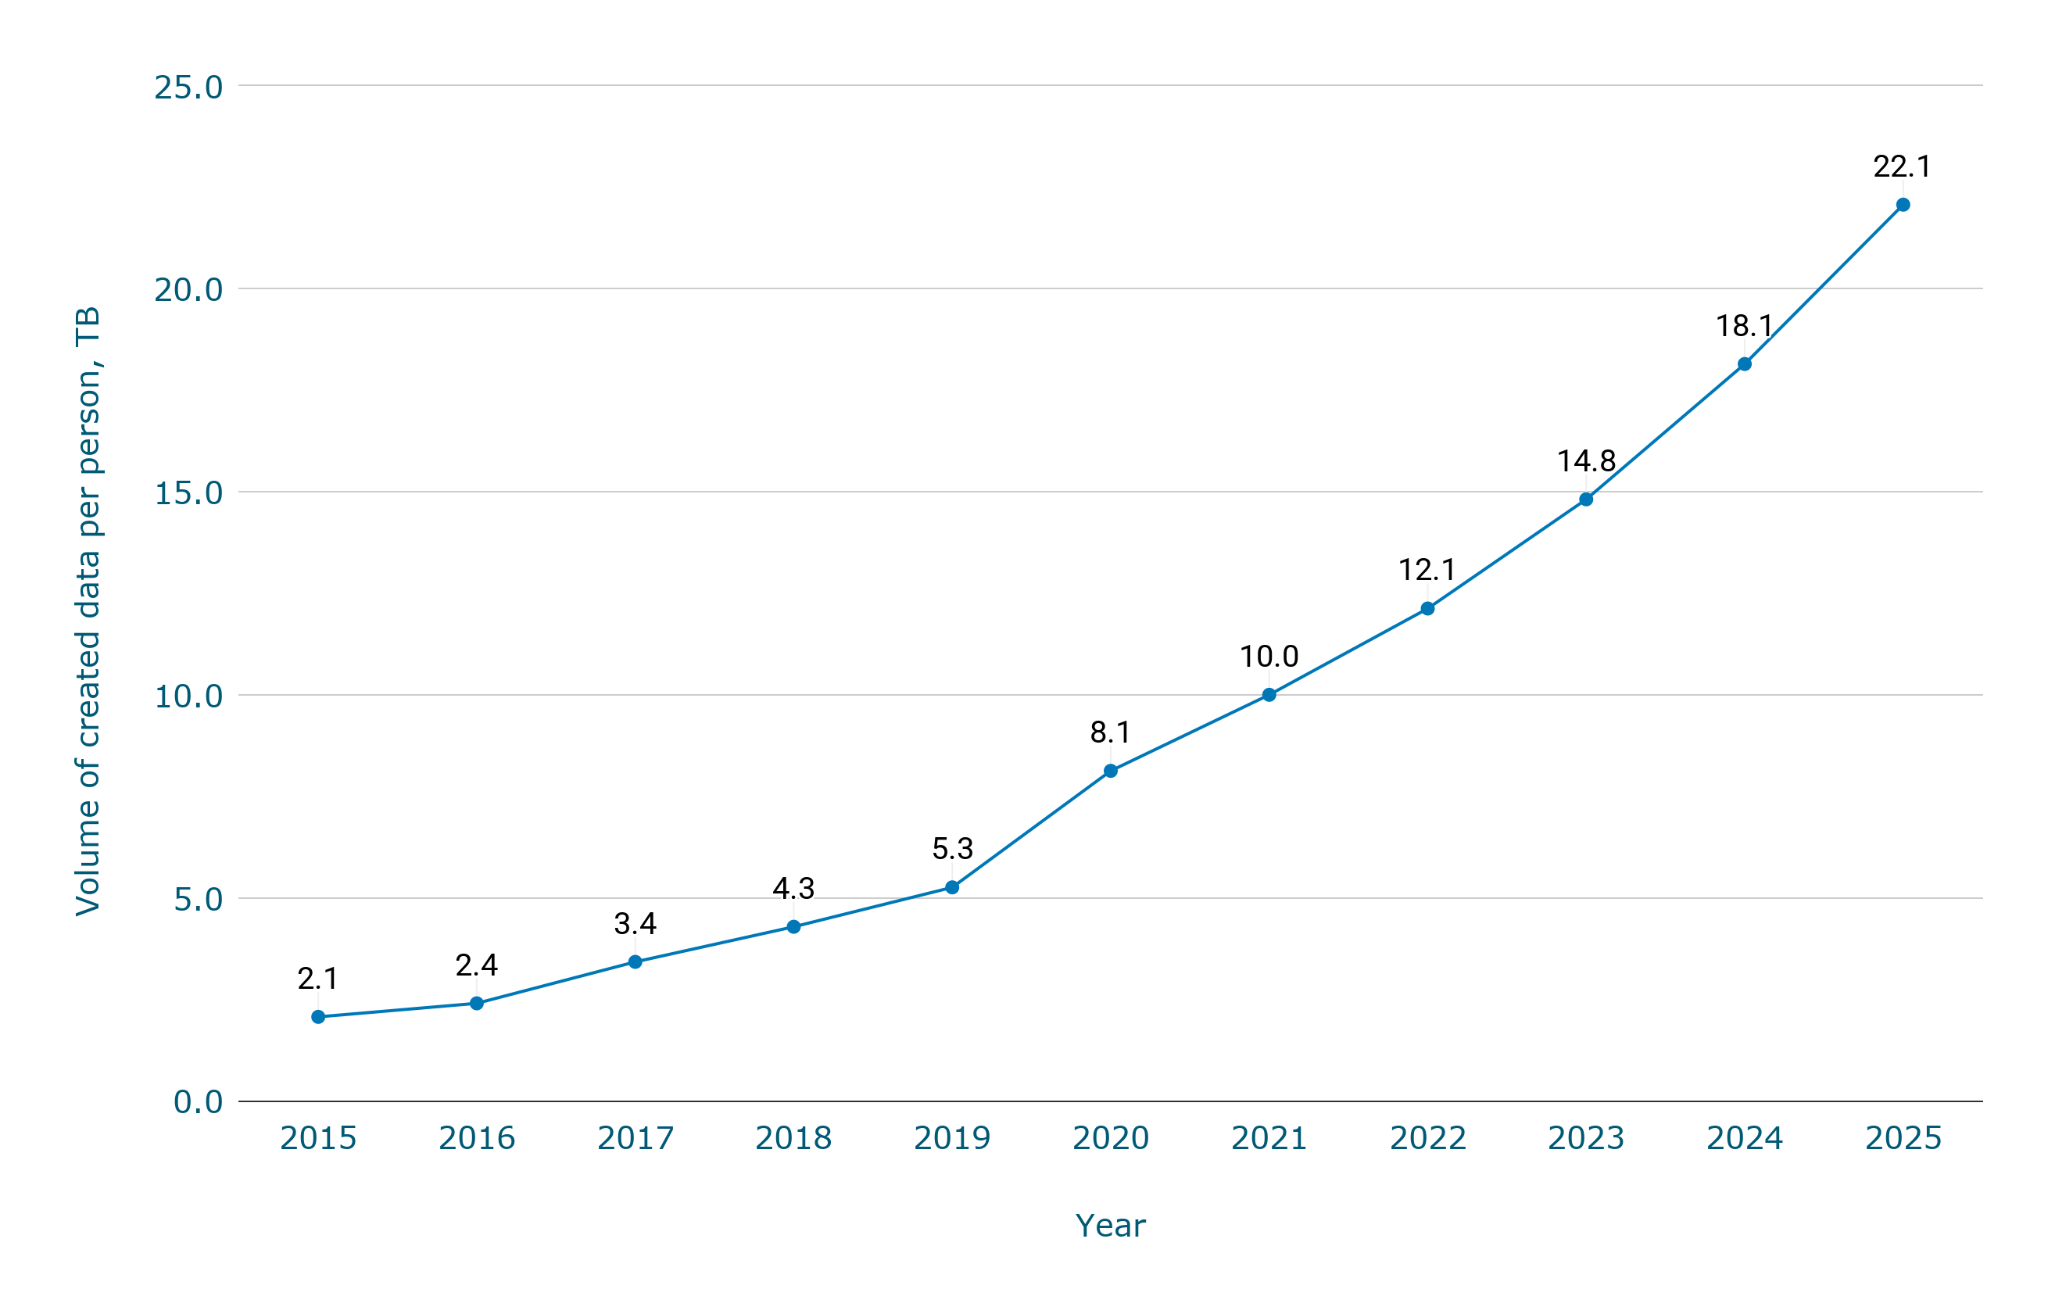
- The volume of created data per person increased from 2.1 TB in 2015 to 5.3 TB in 2019, more than doubling over four years.
- In 2021, per-person data generation reached 10.0 TB, compared with 8.1 TB in 2020, an increase of 1.9 TB per person.
- By 2025, how much data is created every day per person is projected to rise to 22.1 TB, more than ten times the 2015 level.
Average data generated per day per person: Global per-capita trends
| Year | Volume of created data per person, TB |
| 2015 | 2.1 |
| 2016 | 2.4 |
| 2017 | 3.4 |
| 2018 | 4.3 |
| 2019 | 5.3 |
| 2020 | 8.1 |
| 2021 | 10.0 |
| 2022 | 12.1 |
| 2023 | 14.8 |
| 2024 | 18.1 |
| 2025 | 22.1 |
The data shows a consistent upward trend in per-capita data creation over the observed period. As global data generation increases, the amount of data generated per day per person has risen steadily, reflecting higher levels of digital activity worldwide. These data-generated per-day statistics provide a clearer understanding of how much personal data is collected every day when viewed on an individual basis rather than in aggregate terms.
After examining data generation on a per-person basis, the next step is to break down how much data is created across different time units.
Data generation by time unit: How much data is generated every second, minute, and year
The table presents a time-based breakdown of global data creation, showing how much data is generated every second, minute, hour, and day. It translates daily global data generation into smaller and larger time units to provide additional perspective. This breakdown also supports comparisons with global data generated annually by scaling daily figures across longer periods.
| Time unit | Amount of data created, TB |
| Per day | 2.5 million |
| Per hour | 104 thousand |
| Per minute | 1,736 |
| Per second | 29 |
- How much data is generated every second is approximately 29 TB, based on current daily global data creation levels.
- How much data is generated every minute reaches 1,736 TB, which corresponds to 104 thousand TB per hour.
- How much data is created every day totals about 2.5 million TB, forming the basis for estimates of how much data is generated every year.
The time-based breakdown highlights the continuous nature of global data creation across all units of measurement. By expressing how much data is generated every minute and every second, the figures provide a more granular understanding of overall data production. These metrics complement estimates of global data generated annually and help quantify the scale of data creation over both short and extended time horizons.
While time-based metrics show how continuously data is created, this scale of data generation relies on a physical infrastructure that supports storage, processing, and transmission.
Infrastructure behind global data generation: Distribution of data centers by country
The chart lists the top countries by number of data centers, highlighting where global data generation infrastructure is most concentrated. It reflects the geographic distribution of facilities that support large-scale data creation and management. This overview provides context for understanding how global data generation is enabled at the infrastructure level.
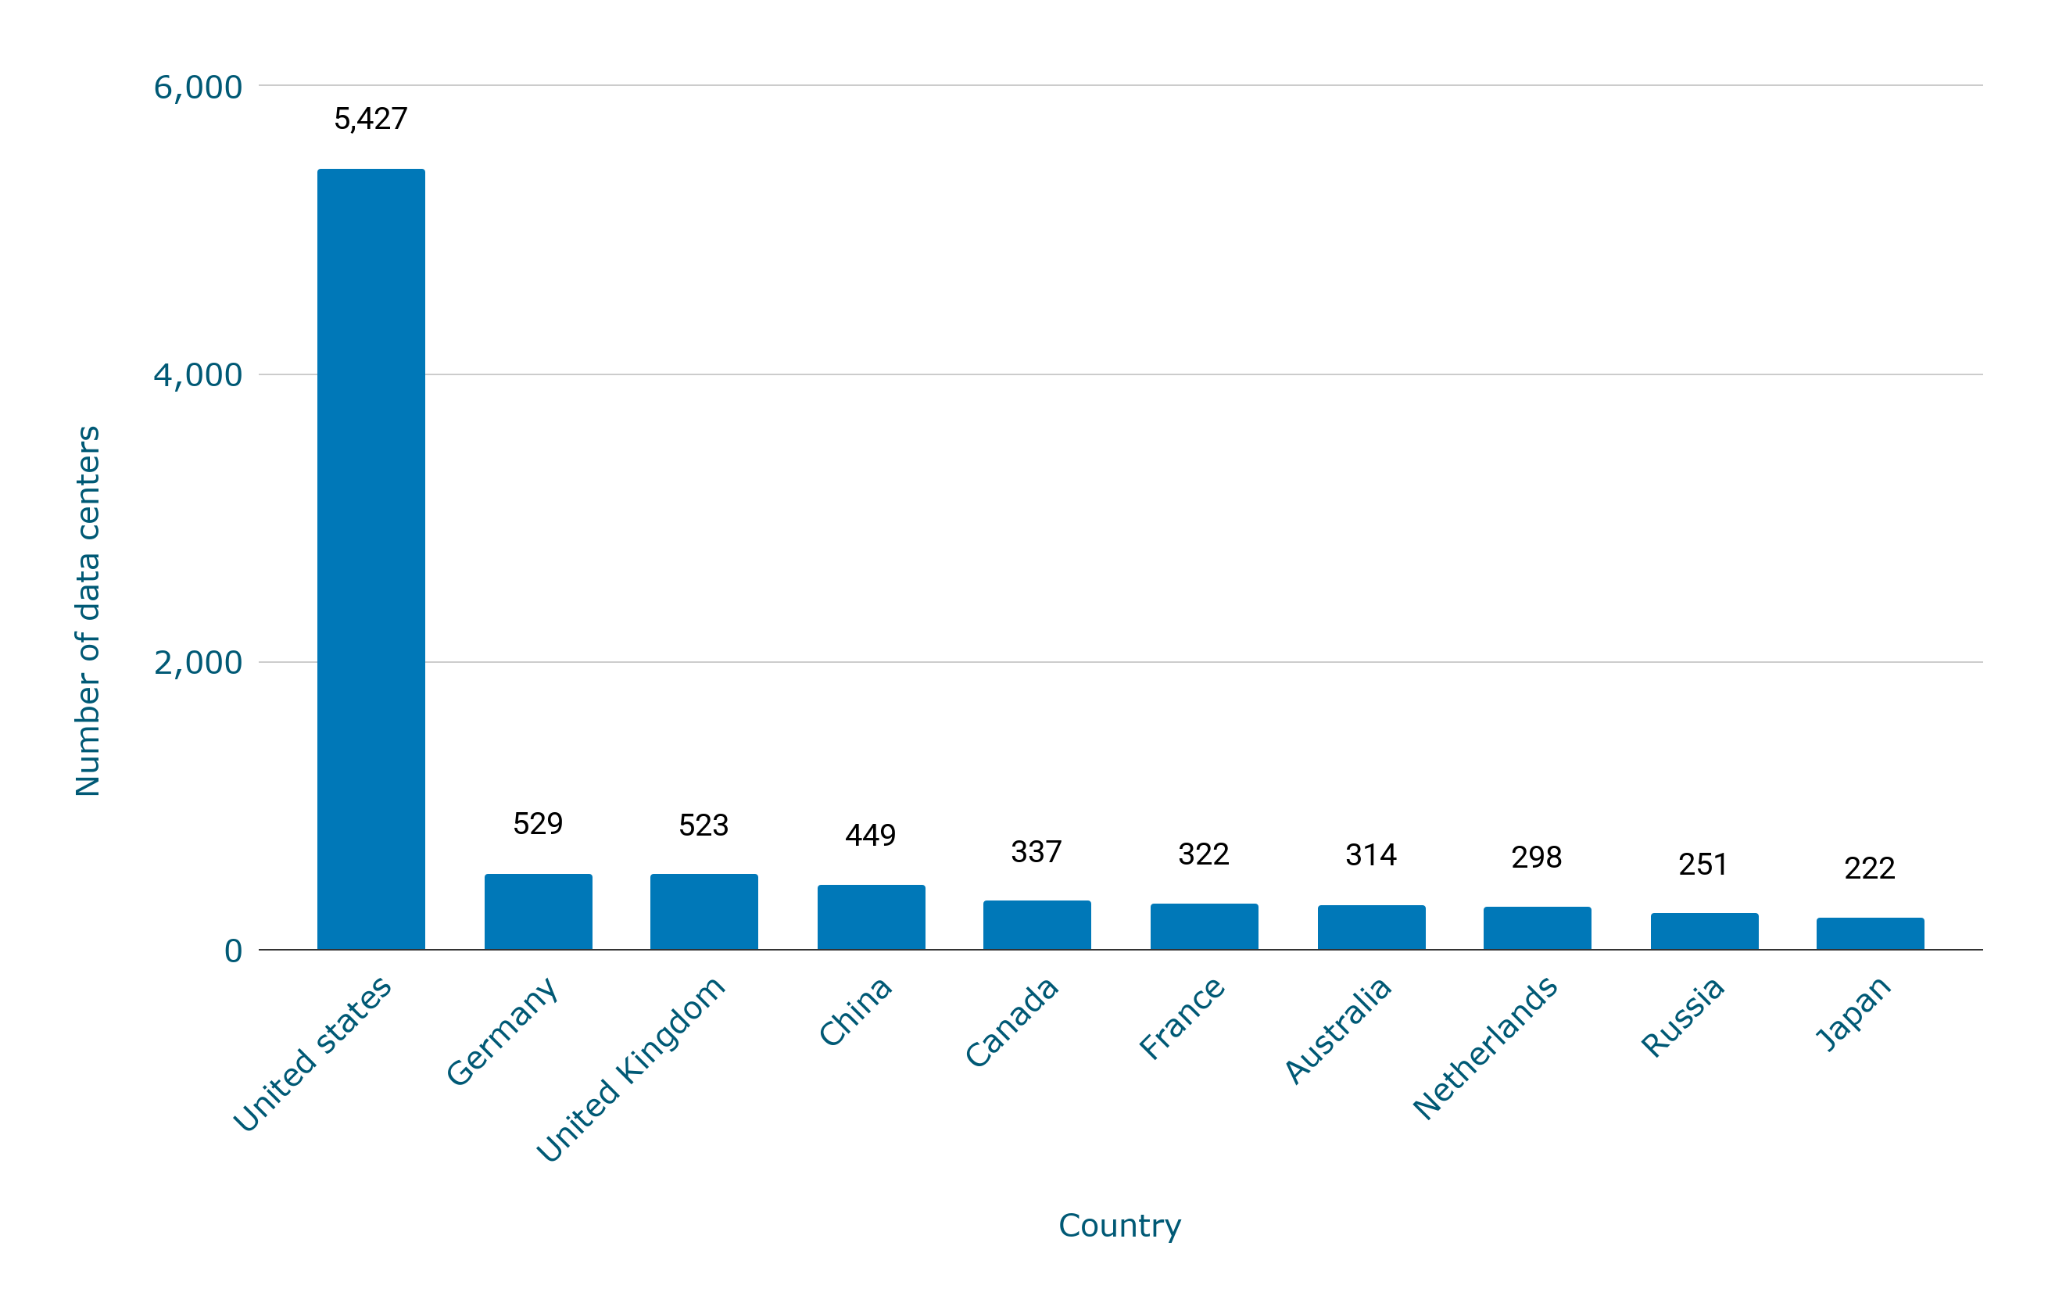
- The United States leads global data generation infrastructure with 5,427 data centers, more than ten times the count of any other country listed.
- Germany and the United Kingdom follow with 529 and 523 data centers, respectively, indicating a high concentration of infrastructure in Europe.
- Among the top ten countries, data center counts range from 222 in Japan to 449 in China, showing a wide spread in infrastructure scale.
Global data generation infrastructure: Top countries by data center count
| Rank | Country | Number of data centers |
| 1 | United states | 5,427 |
| 2 | Germany | 529 |
| 3 | United Kingdom | 523 |
| 4 | China | 449 |
| 5 | Canada | 337 |
| 6 | France | 322 |
| 7 | Australia | 314 |
| 8 | Netherlands | 298 |
| 9 | Russia | 251 |
| 10 | Japan | 222 |
The data indicates that the global data generation infrastructure is highly concentrated in a small number of countries. Nations with advanced digital economies host significantly larger numbers of data centers, supporting higher levels of data processing and storage capacity. This uneven geographic distribution plays a key role in shaping how global data generation is supported and scaled worldwide.
After examining the infrastructure that supports global data generation, the next step is to identify which activities contribute most to overall data creation.
Data creation by source: Distribution of global data generation
The chart shows the distribution of global data creation by source, expressed as a percentage share of total data volume. It breaks down how different categories of digital activity contribute to overall data generation. This view helps explain which sources account for the largest portions of newly created data.
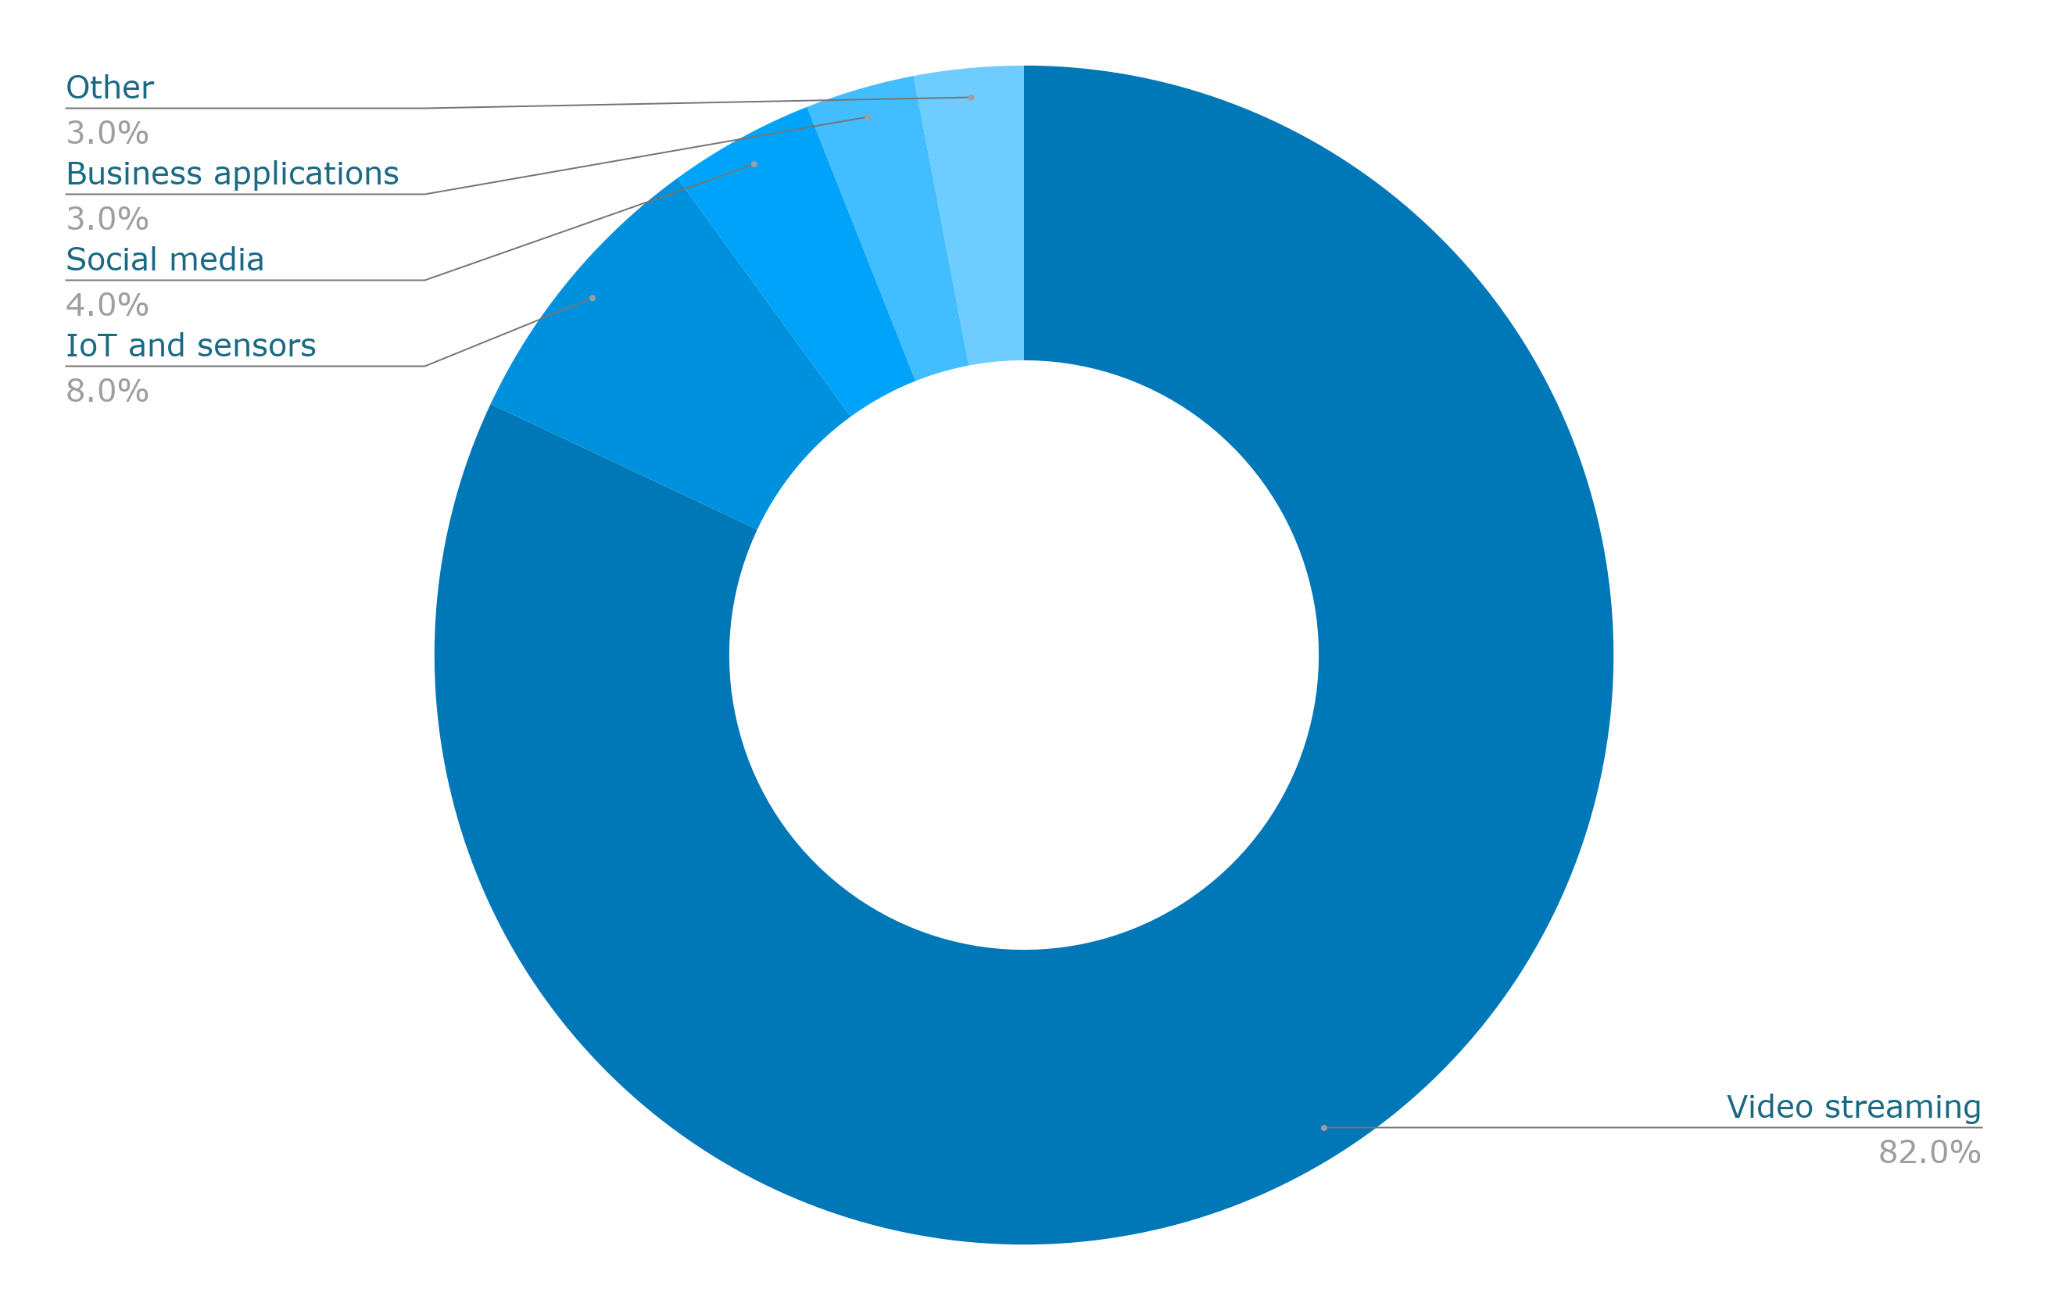
- Video streaming and content account for 82% of total global data creation, making it the dominant source by a wide margin.
- IoT and sensors contribute 8% of global data generation, representing the second-largest source in the breakdown.
- Social media and business applications together account for 7% of total data creation, while other sources contribute 3%.
Sources of global data creation: Share of total data volume
| Source | Share, % |
| Video streaming and content | 82% |
| IoT and sensors | 8% |
| Social media | 4% |
| Business applications | 3% |
| Other | 3% |
The data shows that global data creation is highly concentrated in a small number of activity types. Video-related content accounts for the majority of total data volumes, while other sources contribute relatively small shares. This distribution provides important context for understanding how different digital activities drive overall global data generation.
Conclusions
- Global data creation has reached a scale measured in hundreds of zettabytes, with total data volume increasing from 15.5 zettabytes in 2015 to a projected 181 zettabytes by 2025. This expansion reflects a sustained accumulation of digital information rather than short-term volatility, establishing global data growth as a structural feature of the digital economy.
- Over time, data growth has not followed a constant linear path. Annual growth rates peaked sharply in 2020 at 56.6%, followed by a period of stabilization in which growth remained consistently above 20% per year. This pattern suggests that while the pace of expansion remains high, global data growth has transitioned from episodic acceleration to sustained, predictable increases.
- At the daily level, the scale of data generation has expanded dramatically, rising from 5.48 million terabytes per day in 2010 to nearly 496 million terabytes per day by 2025. When translated to a per-person basis, this growth corresponds to an increase from 2.1 terabytes per person in 2015 to more than 22 terabytes per person in 2025, indicating that rising global volumes are closely tied to individual digital activity.
- The continuous nature of data creation is further illustrated by time-based measurements, with global systems generating tens of terabytes every second and millions of terabytes each day. Supporting this level of activity requires substantial physical infrastructure, which remains highly concentrated in a small number of countries, particularly the United States and Western Europe.
- Finally, global data creation is driven disproportionately by a limited set of sources. Video streaming and content account for more than four-fifths of total data volume, while other sources such as IoT, social media, and business applications contribute comparatively smaller shares. Taken together, these findings show that understanding how much data is generated every day requires considering not only volume and growth, but also per-person impact, infrastructure distribution, and the activities that dominate global data creation.
Methodology
Per-person data volume was calculated by dividing total global data volume by the world population for each corresponding year. Total data volumes were expressed in zettabytes and converted into terabytes to ensure consistent units across calculations. Population figures were applied at the global level, allowing daily and annual data creation to be translated into per-capita estimates.
This approach provides an average measure of how much data is generated per person worldwide. The resulting values represent global aggregates distributed across the total population and do not account for regional, demographic, or individual differences in data generation behavior.
Sources
- Geuens, "How Much Data Is Generated Every Day?" Dark Logo, 19 Feb. 2025, https://soax.com/research/data-generated-per-day. Accessed 27 February 2026.
- Kumar, Naveen. "Big Data Statistics 2026 (Growth, Trends & Market Size)." DemandSage, 29 Dec. 2025, https://www.demandsage.com/big-data-statistics/. Accessed 27 February 2026.
- Leichter, Rasmus. "Number of Data Centers by Country (November 2025) | Cargoson." Number of Data Centers by Country (November 2025) | Cargoson, 3 Nov. 2025, https://www.cargoson.com/en/blog/number-of-data-centers-by-country. Accessed 27 February 2026.
- StatsPanda. "Terabytes of Data Created Globally - Live Counter | StatsPanda." StatsPanda, https://statspanda.com/live-counters/terabytes-of-data-created-globally. Accessed 27 February 2026.
- "World Population (2026)." PopulationTODAY Population Data Is Included in World Statistical Data, Which Can Provide Insight into the Population Size, Population Growth Rate, and Population Density of a given Country or Region, https://populationtoday.com. Accessed 27 February 2026.
Was this article helpful to you?
 Yes
 No
VPS popular offers
-9.7%


 Windows
€ 138.99 /mo
Billed annually
-7.2%
 Linux
€ 5.92 /mo
Billed annually
-10%
Windows
€ 19.99 /mo
Billed annually
-13.3%
Linux
€ 11.33 /mo
Billed annually
-10%
Linux
€ 135.49 /mo
Billed annually
-5%
Windows
€ 12.1 /mo
Billed annually
-10%
Windows
€ 9.9 /mo
Billed annually
-10%
Linux
€ 115.5 /mo
Billed annually
-10%
Windows
€ 29.99 /mo
Billed annually
-10%
Linux
€ 15.95 /mo
Billed annually


