


What Percentage of Website Traffic Is Mobile Worldwide? - [Updated March 2026]
 10m, 33s
 2
09:32, 13.03.2026

Key findings:
- As of January 2026, mobile accounts for 50.59% of global website traffic, slightly ahead of desktop at 48.05%, indicating a narrow but consistent mobile lead.
- Mobile’s share of website traffic increased from 0.98% in 2009 to 50.91% in 2026, representing a gain of nearly 50 percentage points over 17 years.
- Mobile overtook desktop for the first time in 2017, accounting for 51.59% of total website traffic.
- The highest recorded mobile website traffic share was 60.97% in 2024, followed by a decline to 50.91% in 2026, indicating increased year-to-year variability after 2020.
- Regional differences are substantial: in 2025, mobile generated 79.12% of website traffic in Africa, compared with 56.75% in North America and 50.64% in Europe.
- Industry usage varies widely, with mobile accounting for 80.0% of social media traffic but only 34.7% of B2B SaaS website traffic, highlighting structural differences in browsing behavior.
- Chrome’s mobile browser share rose from 0.00% in 2009 to 66.41% in 2026, while Safari declined from 35.04% to 24.30% over the same period.
- Mobile search adoption progressed faster than website usage: the mobile share of Google searches increased from 8% in 2011 to 78% in 2024, crossing the 50% mark in 2017.
Mobile devices have become the primary way people access the web, but the exact share of global website traffic coming from mobile has changed significantly over time and varies by context. Depending on the year, region, industry, and measurement method, mobile’s share of web traffic can differ by more than 20 percentage points.
This article provides a comprehensive, data-based overview of mobile website traffic worldwide, using long-term historical data and the most recent available figures. It starts with the current global snapshot for January 2026, then traces how mobile traffic has evolved since 2009, including the point at which mobile overtook desktop. The analysis also breaks mobile traffic down by region and industry, examines browser usage on mobile devices, and compares mobile website traffic with the share of Google searches performed on mobile.
All figures are presented as percentages of total web or search traffic, allowing consistent comparisons across years and segments. The goal is not to predict user behavior, but to clearly document how much of today’s internet traffic is mobile, how that share has changed over time, and where mobile usage is strongest today.
With the long-term dynamics of web usage established, the next step is to look at the current web traffic distribution by device.
Global mobile share of website traffic in January 2026
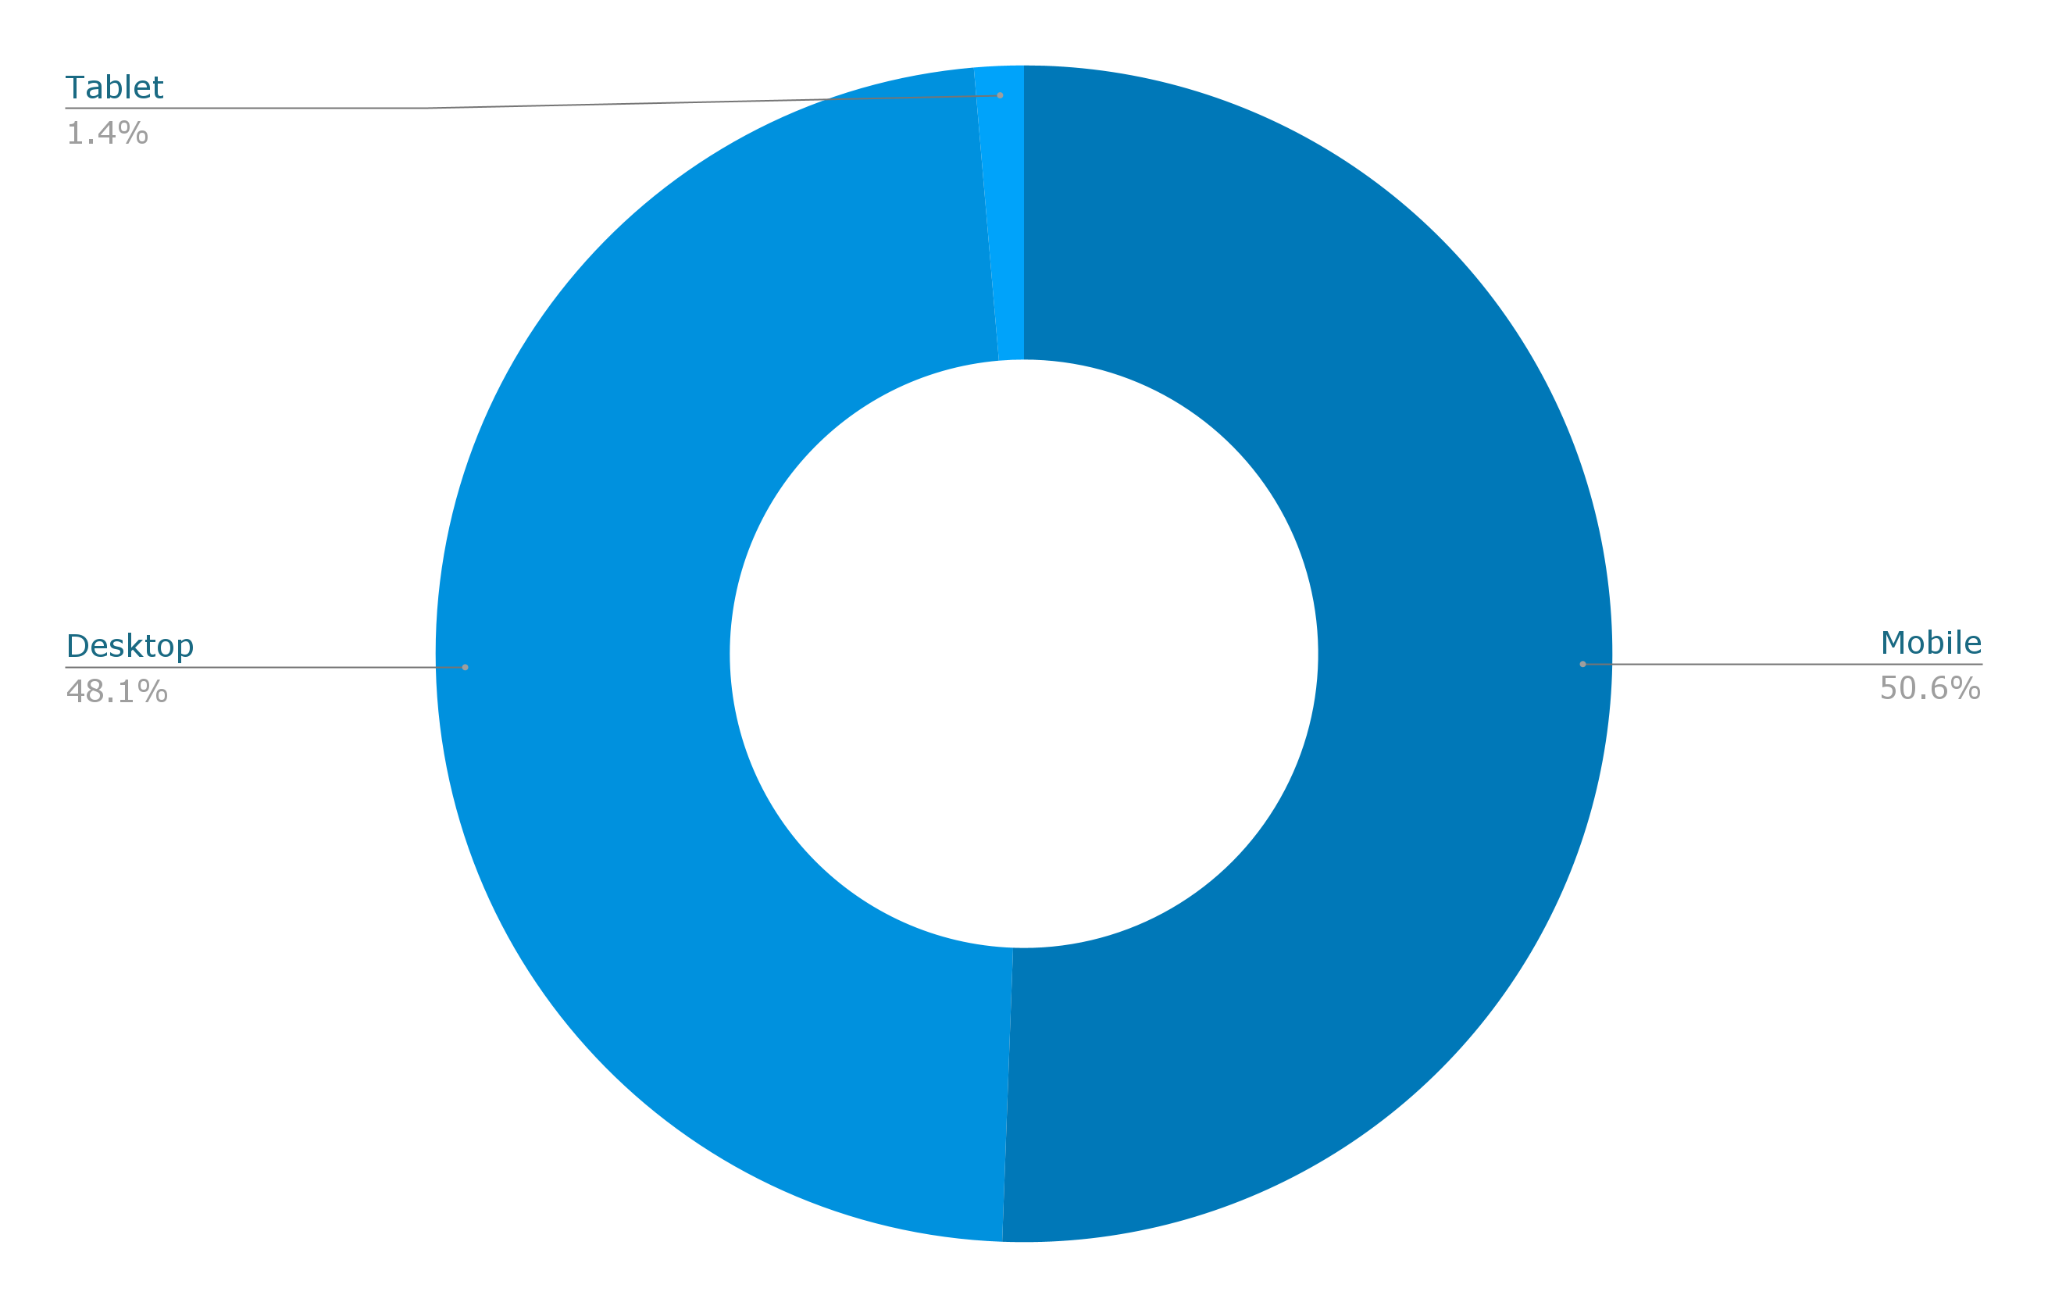
The chart below shows the current web traffic split by device as of January 2026, based on aggregated global data. It illustrates how mobile, desktop, and tablet devices contribute to total website visits at a single point in time, providing a clear snapshot of current web traffic.
What percentage of web traffic is mobile?
- In January 2026, mobile traffic accounted for 50.59% of total website traffic, making mobile the largest single source of web visits.
- Desktop devices represented 48.05% of global website traffic, remaining only 2.54 percentage points behind mobile.
- Tablet usage was minimal, with a 1.36% share of website traffic worldwide.
Percentage of web traffic on mobile worldwide (January 2026)
| Source | Share |
| Mobile | 50.59% |
| Desktop | 48.05% |
| Tablet | 1.36% |
These figures show that mobile devices hold a narrow majority of global website traffic at the beginning of 2026. While mobile leads overall, the small gap between mobile and desktop indicates that web usage remains split across platforms rather than dominated by a single device type. This snapshot provides a baseline for understanding how much web traffic is mobile before examining longer-term trends, regional differences, and industry-specific patterns in later sections.
After establishing the current global snapshot, it is necessary to examine how web traffic by device has evolved.
Mobile vs desktop vs tablet website traffic (2009-2026)
The chart below tracks website traffic by year from 2009 to 2026, showing the changing distribution between desktop, mobile, and tablet devices. This historical view highlights long-term website traffic trends and how device usage has shifted across nearly two decades of global mobile traffic growth.
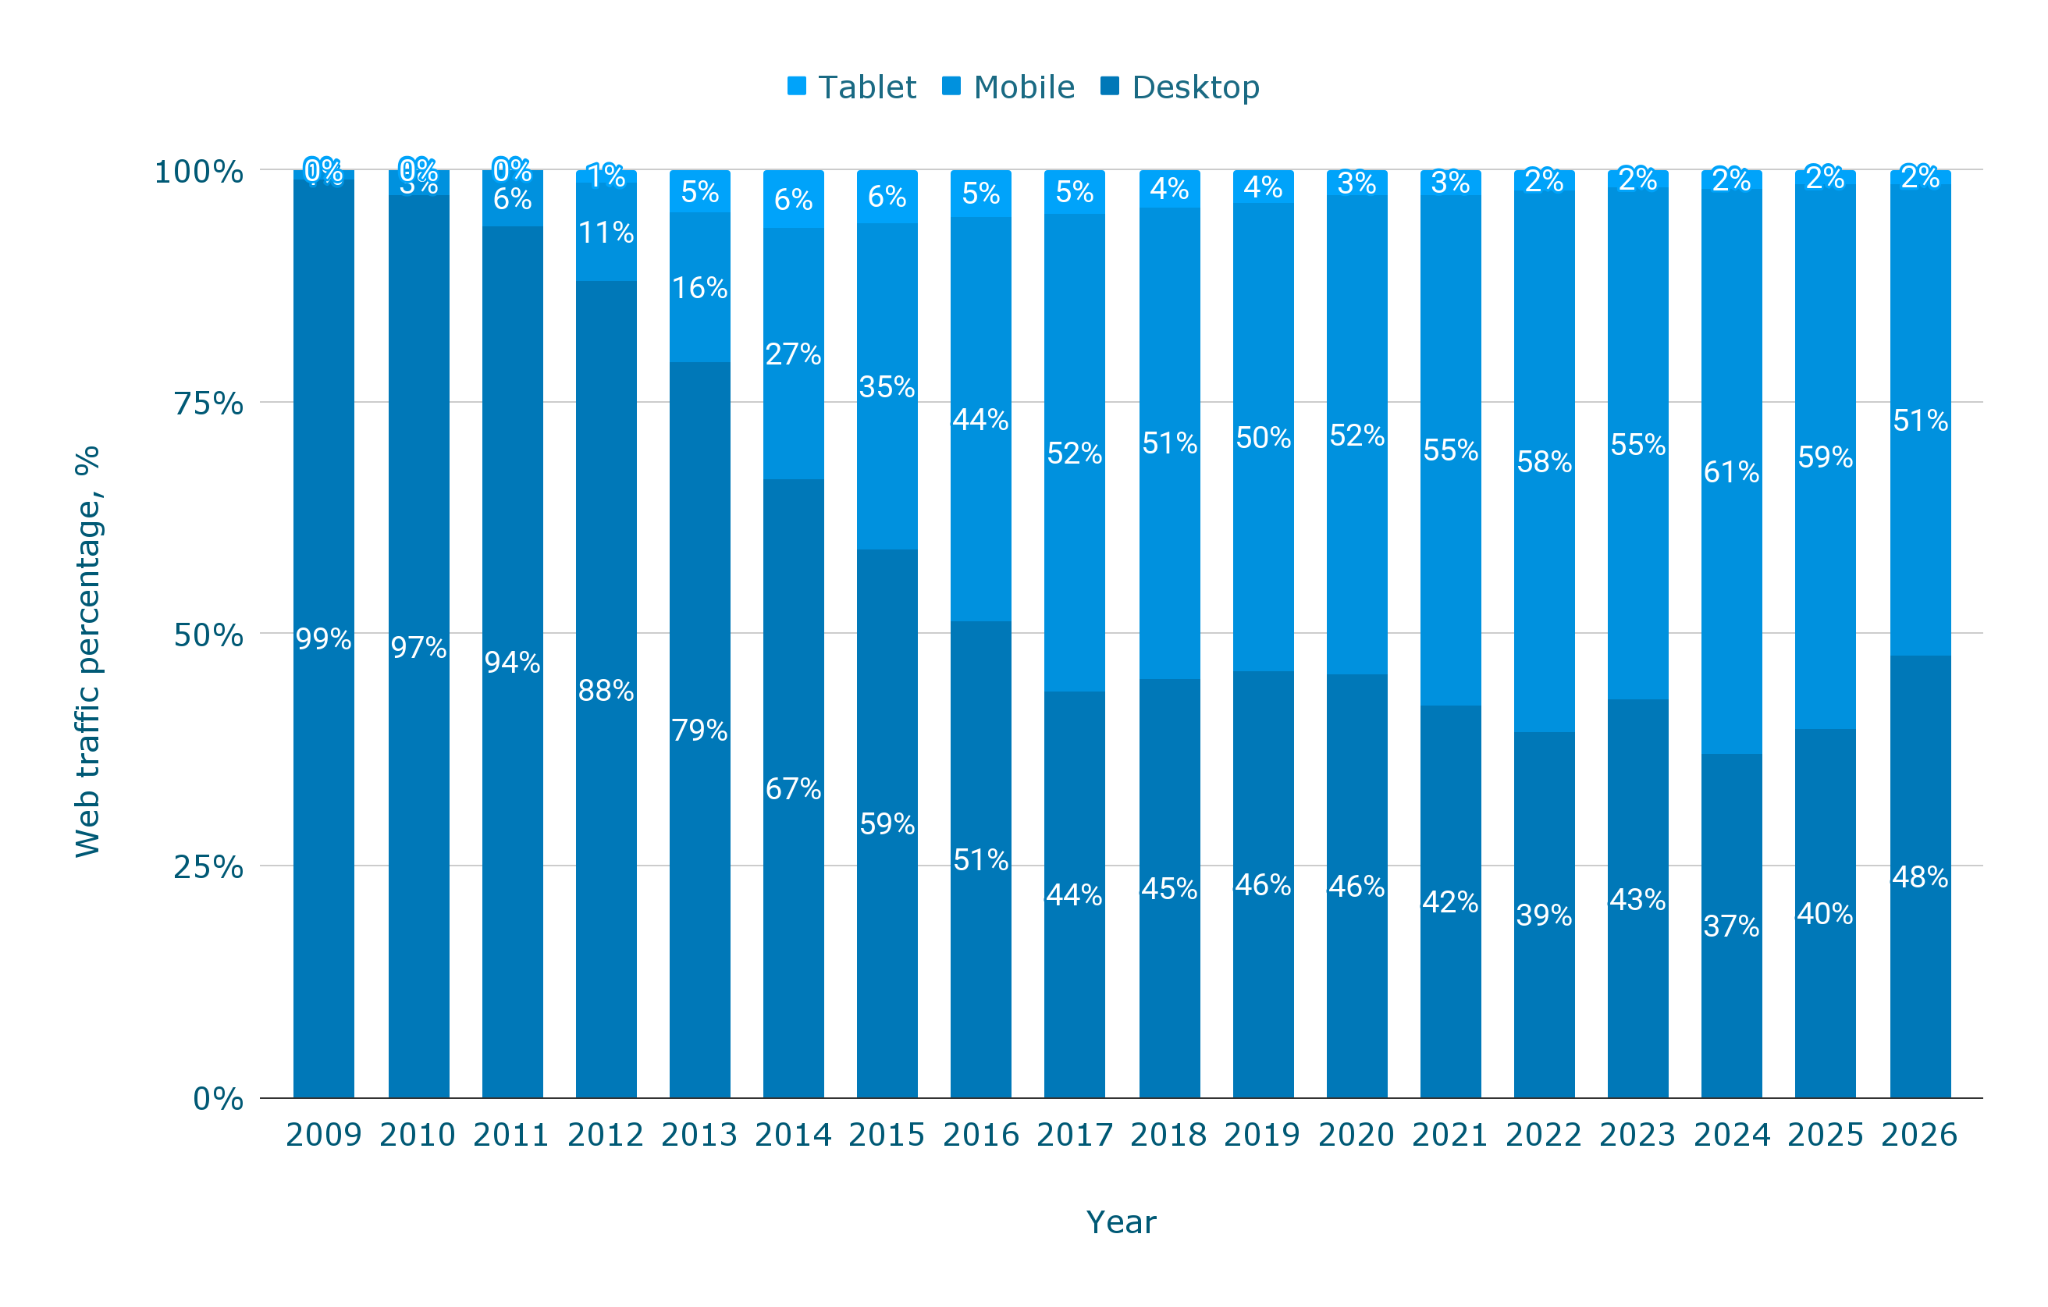
- Desktop’s share of website traffic declined from 99.02% in 2009 to 47.60% in 2026, a drop of more than 51 percentage points.
- Mobile traffic increased from 0.98% in 2009 to 50.91% in 2026, overtaking desktop for the first time in 2017.
- Tablet usage peaked at 6.28% in 2014 and fell to 1.50% by 2026, remaining a minor component of total traffic.
| Year | Desktop share, % | Mobile share, % | Tablet share, % |
| 2009 | 99.02% | 0.98% | 0.00% |
| 2010 | 97.18% | 2.82% | 0.00% |
| 2011 | 93.89% | 6.11% | 0.00% |
| 2012 | 87.95% | 10.74% | 1.31% |
| 2013 | 79.21% | 16.20% | 4.59% |
| 2014 | 66.66% | 27.06% | 6.28% |
| 2015 | 59.09% | 35.20% | 5.72% |
| 2016 | 51.30% | 43.67% | 5.03% |
| 2017 | 43.74% | 51.59% | 4.68% |
| 2018 | 45.19% | 50.81% | 4.01% |
| 2019 | 46.00% | 50.44% | 3.56% |
| 2020 | 45.59% | 51.66% | 2.75% |
| 2021 | 42.30% | 55.02% | 2.68% |
| 2022 | 39.38% | 58.38% | 2.25% |
| 2023 | 42.85% | 55.22% | 1.93% |
| 2024 | 36.99% | 60.97% | 2.04% |
| 2025 | 39.79% | 58.63% | 1.58% |
| 2026 | 47.59% | 50.90% | 1.50% |
The data show a clear structural shift in mobile vs desktop website traffic over time, with mobile becoming the dominant access method after years of steady growth. While desktop traffic remains significant, its long-term decline contrasts with the sustained rise of mobile website traffic across most years. Tablet usage, by comparison, represents a small and diminishing share, indicating that changes in traffic share by platform have been driven primarily by the mobile-desktop transition rather than by tablets.
While the previous section compared devices side by side, this section focuses specifically on how mobile usage has evolved.
Mobile website traffic share by year (2009-2026)
The chart below shows mobile website traffic share by year from 2009 to 2026, isolating mobile from other device categories. This view highlights long-term website traffic trends and provides a clear timeline of how mobile’s role in total web usage has changed.
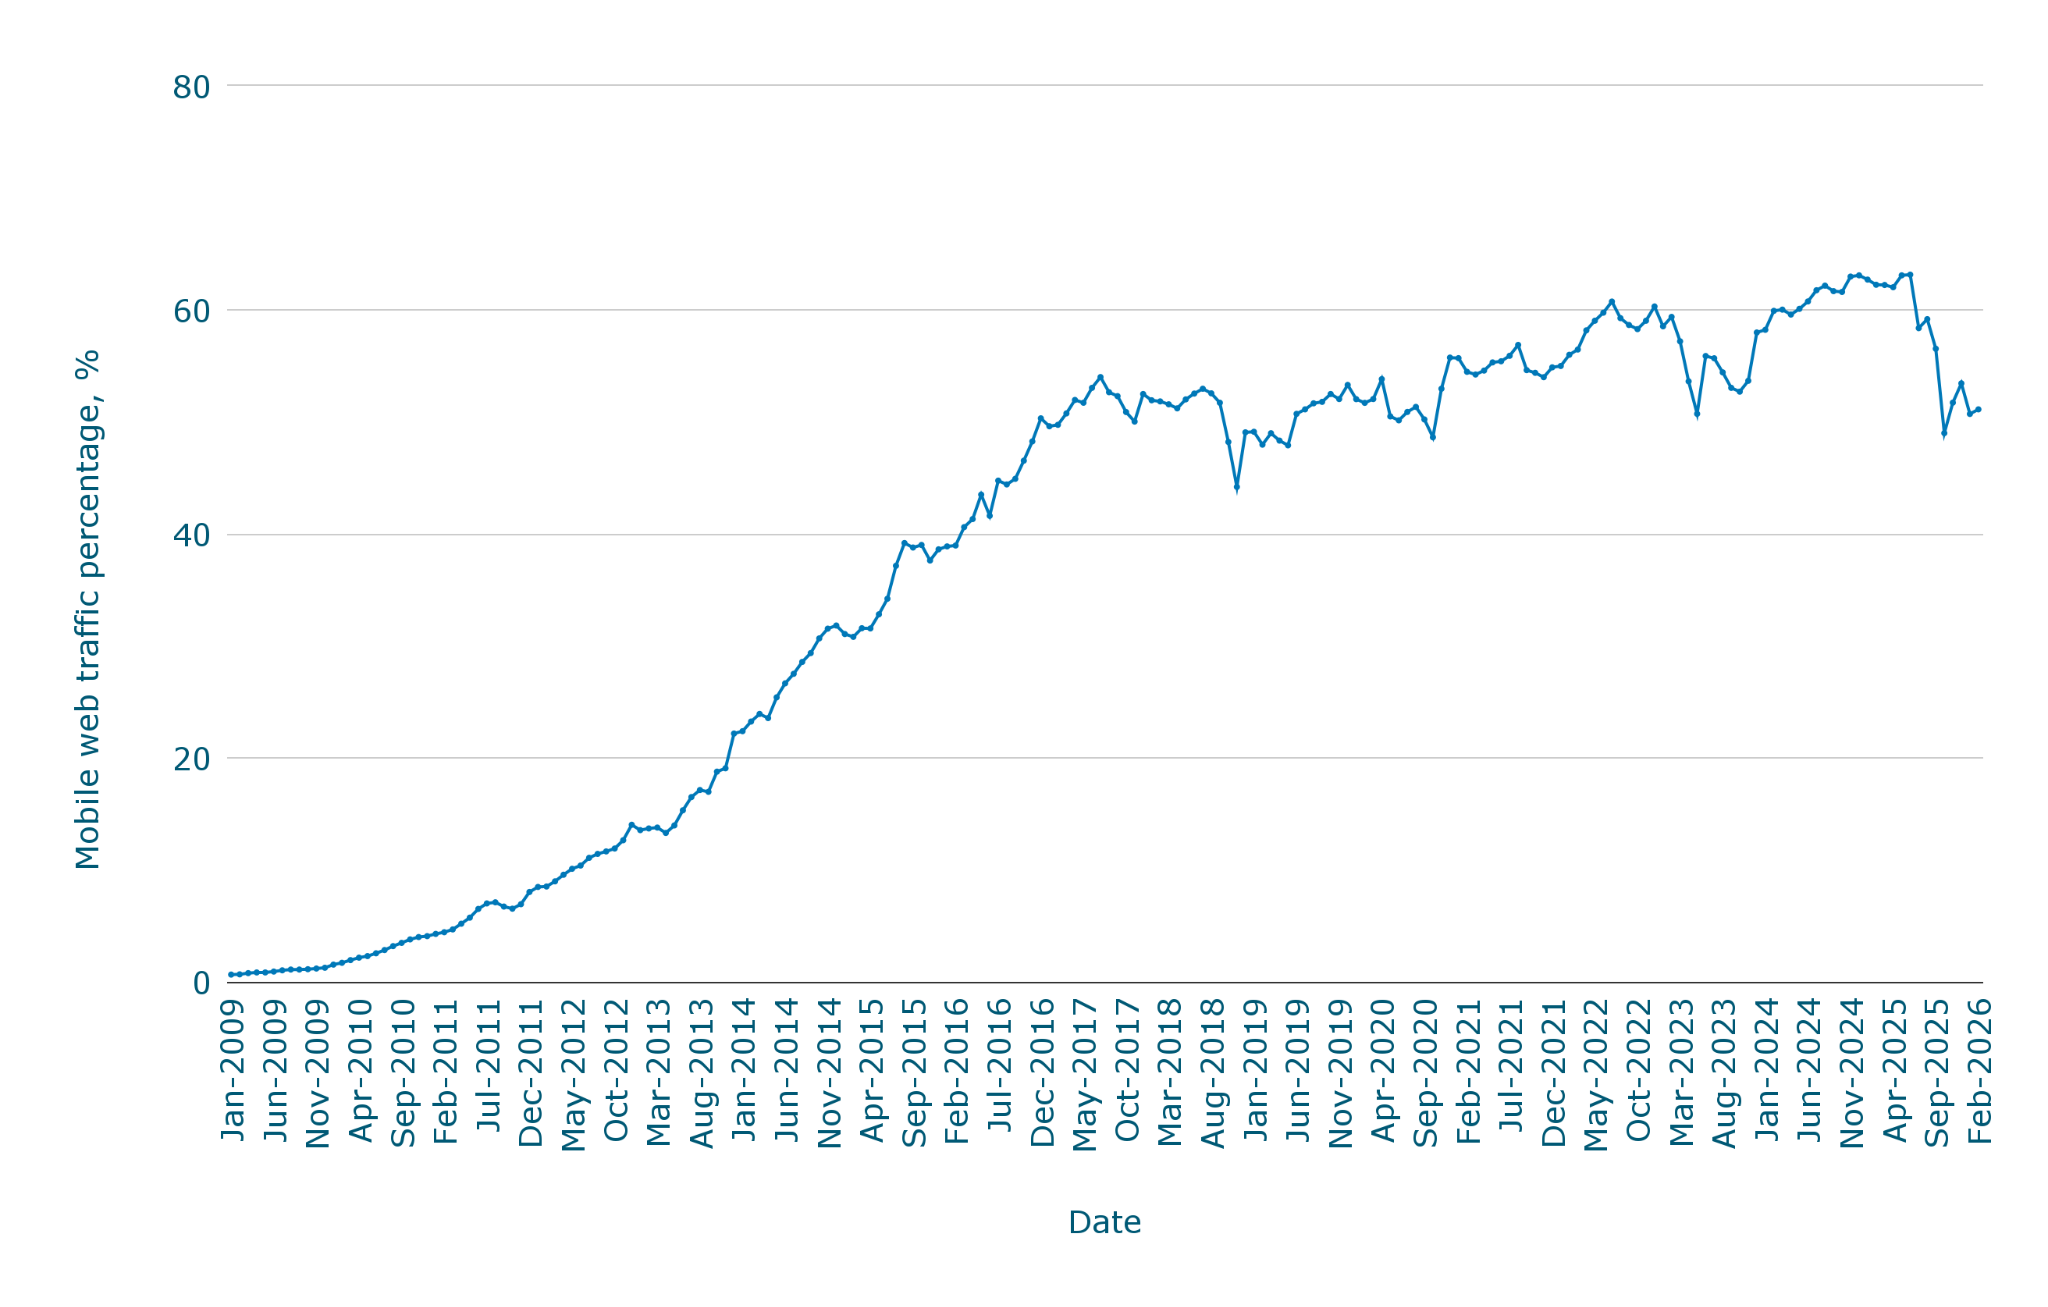
- Mobile traffic share increased from 0.98% in 2009 to 50.91% in 2026, representing a gain of nearly 50 percentage points over the period.
- Mobile first exceeded 50% of total website traffic in 2017, reaching 51.59%, and remained above that level in most subsequent years.
- The highest mobile share in the series occurred in 2024 at 60.97%, followed by a decline to 58.63% in 2025 and 50.91% in 2026.
Mobile web traffic trends by year worldwide
| Year | Mobile traffic share, % |
| 2009 | 0.98% |
| 2010 | 2.82% |
| 2011 | 6.11% |
| 2012 | 10.74% |
| 2013 | 16.20% |
| 2014 | 27.06% |
| 2015 | 35.20% |
| 2016 | 43.67% |
| 2017 | 51.59% |
| 2018 | 50.81% |
| 2019 | 50.44% |
| 2020 | 51.66% |
| 2021 | 55.02% |
| 2022 | 58.38% |
| 2023 | 55.22% |
| 2024 | 60.97% |
| 2025 | 58.63% |
| 2026 | 50.91% |
These figures show a sustained long-term increase in mobile website traffic, driven by steady growth through the mid-2010s and consolidation above the 50% threshold after 2017. However, recent fluctuations indicate that mobile dominance is not linear, with year-to-year variation becoming more pronounced after 2020. Overall, the trend confirms how much web traffic is mobile, not only on long-term adoption, but also on short-term shifts in user behavior and device usage patterns.
After examining global trends over time, the next step is to compare how mobile website traffic differs across regions.
Mobile website traffic share by region (2024-2025)
The chart below presents mobile website traffic by region for 2024 and 2025, showing the percentage of total website traffic generated by mobile devices in each region. This regional view highlights differences in global mobile traffic adoption levels and provides context for geographic variation in mobile website traffic.
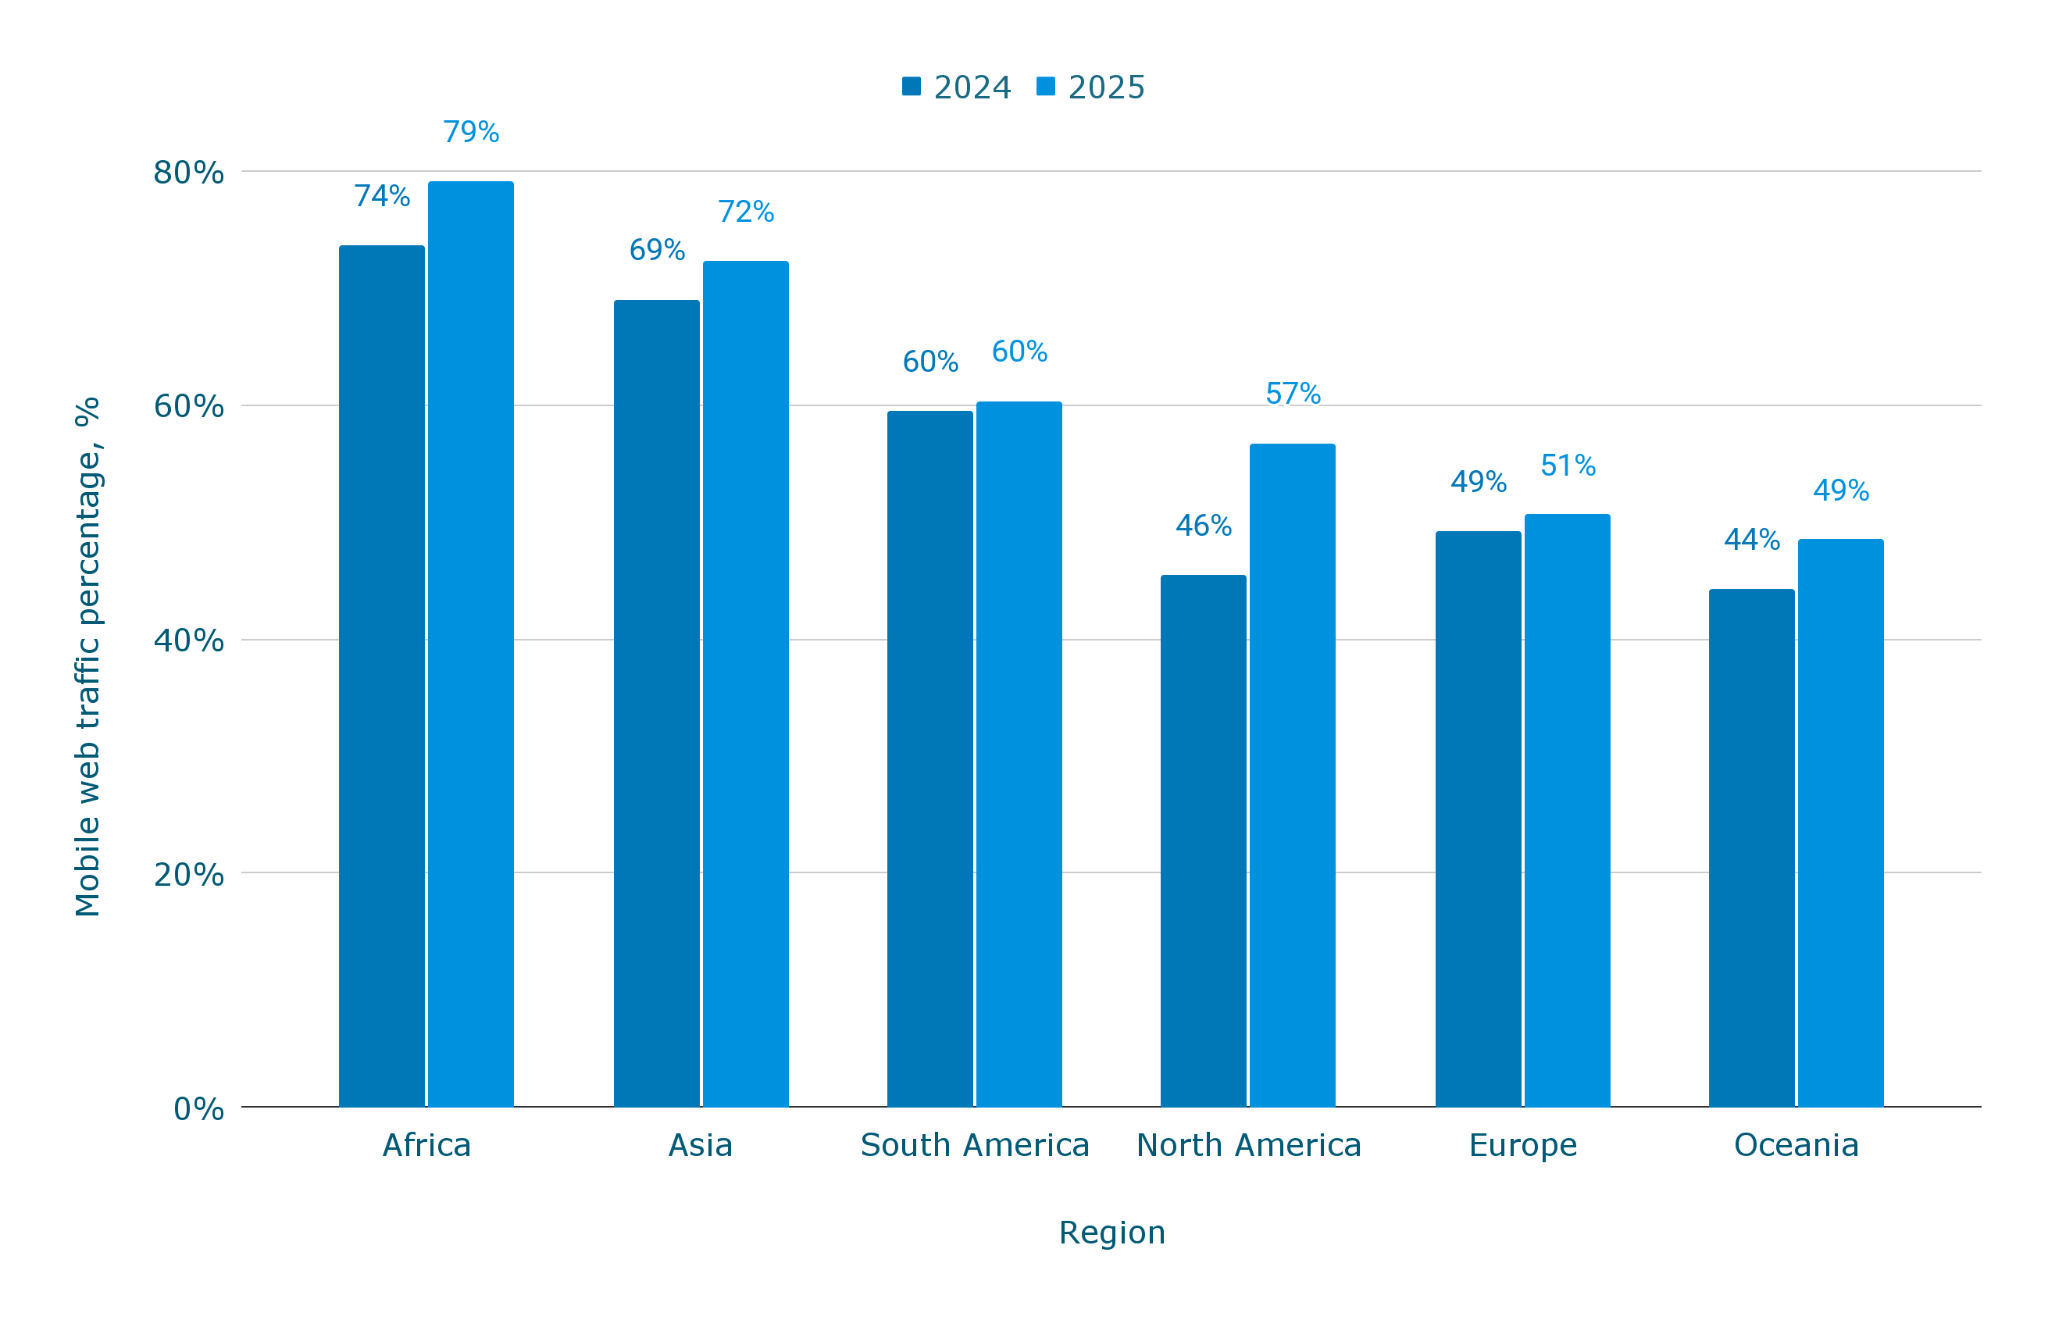
- Africa recorded the highest mobile share, increasing from 73.60% in 2024 to 79.12% in 2025, a rise of 5.52 percentage points.
- North America showed the largest year-over-year increase, with mobile traffic rising from 45.50% in 2024 to 56.75% in 2025, an increase of 11.25 percentage points.
- Europe’s mobile share grew more modestly, moving from 49.19% in 2024 to 50.64% in 2025, crossing the 50% threshold.
Regional distribution of mobile website traffic worldwide
| Region | 2024, % | 2025, % |
| Africa | 73.60% | 79.12% |
| Asia | 69.00% | 72.30% |
| South America | 59.50% | 60.34% |
| North America | 45.50% | 56.75% |
| Europe | 49.19% | 50.64% |
| Oceania | 44.30% | 48.50% |
The regional data indicate that mobile website traffic is already dominant in emerging regions such as Africa and Asia, where mobile accounts for well over two-thirds of total web usage. More mature markets, including Europe and North America, show lower but rapidly increasing mobile shares, suggesting continued convergence toward mobile-first access. Overall, the figures confirm that the share of website traffic coming from mobile devices varies substantially by region, reflecting differences in infrastructure, device adoption, and user behavior.
While regional differences explain where mobile usage is strongest geographically, industry data shows how mobile website traffic varies by type of online activity.
Mobile website traffic share by industry
The chart below compares mobile website traffic across major industries, showing the percentage of total website visits generated by mobile devices. This industry-level breakdown highlights how usage patterns differ depending on content type, user intent, and typical browsing behavior within each sector.
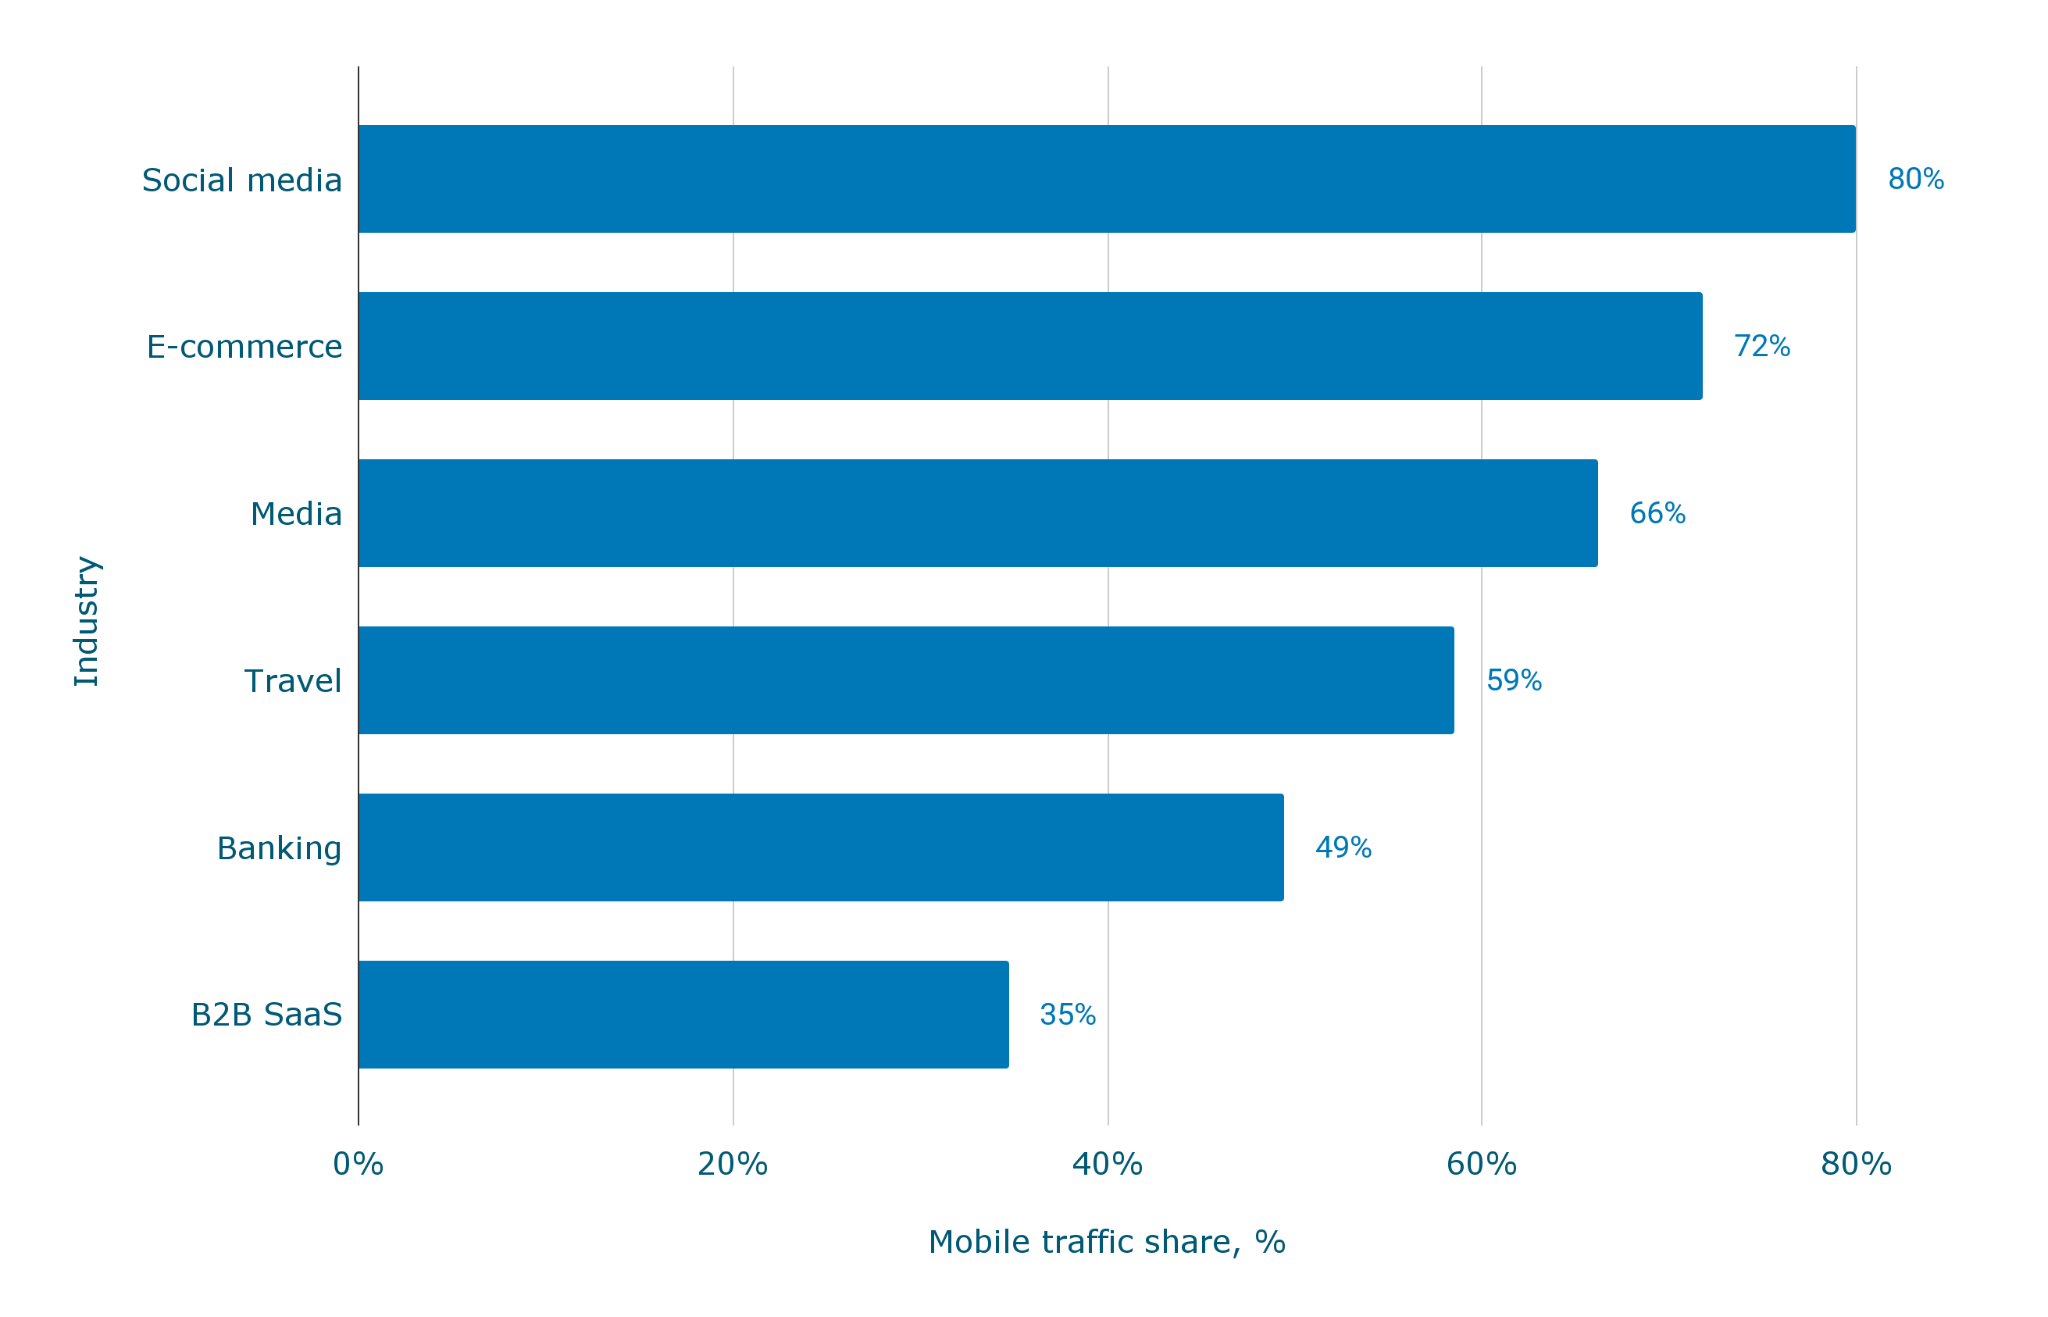
- Social media has the highest mobile share, with 80.0% of website traffic coming from mobile devices.
- E-commerce and media sites also show strong mobile usage, at 71.8% and 66.2% respectively.
- B2B SaaS records the lowest mobile share at 34.7%, indicating a continued reliance on desktop access.
Mobile web traffic across industries
| Industry | Mobile traffic share, % |
| Social media | 80.0% |
| E-commerce | 71.8% |
| Media | 66.2% |
| Travel | 58.5% |
| Banking | 49.4% |
| B2B SaaS | 34.7% |
The data show that mobile website traffic is most dominant in consumer-focused industries where short sessions and frequent visits are common. Sectors such as social media, e-commerce, and media have mobile shares well above the global average, reflecting mobile-first consumption patterns. In contrast, industries involving complex workflows or longer sessions, such as B2B SaaS and banking, maintain a lower traffic share by platform, highlighting structural differences in how users access websites across industries.
After examining how mobile website traffic differs by industry, the next step is to look at how that traffic is distributed across mobile browsers.
Mobile browser market share worldwide (2009-2026)
The chart below shows the distribution of mobile web traffic across major browsers from 2009 to 2026. It illustrates long-term website traffic trends in browser usage and provides context for how users access mobile websites at a global level.
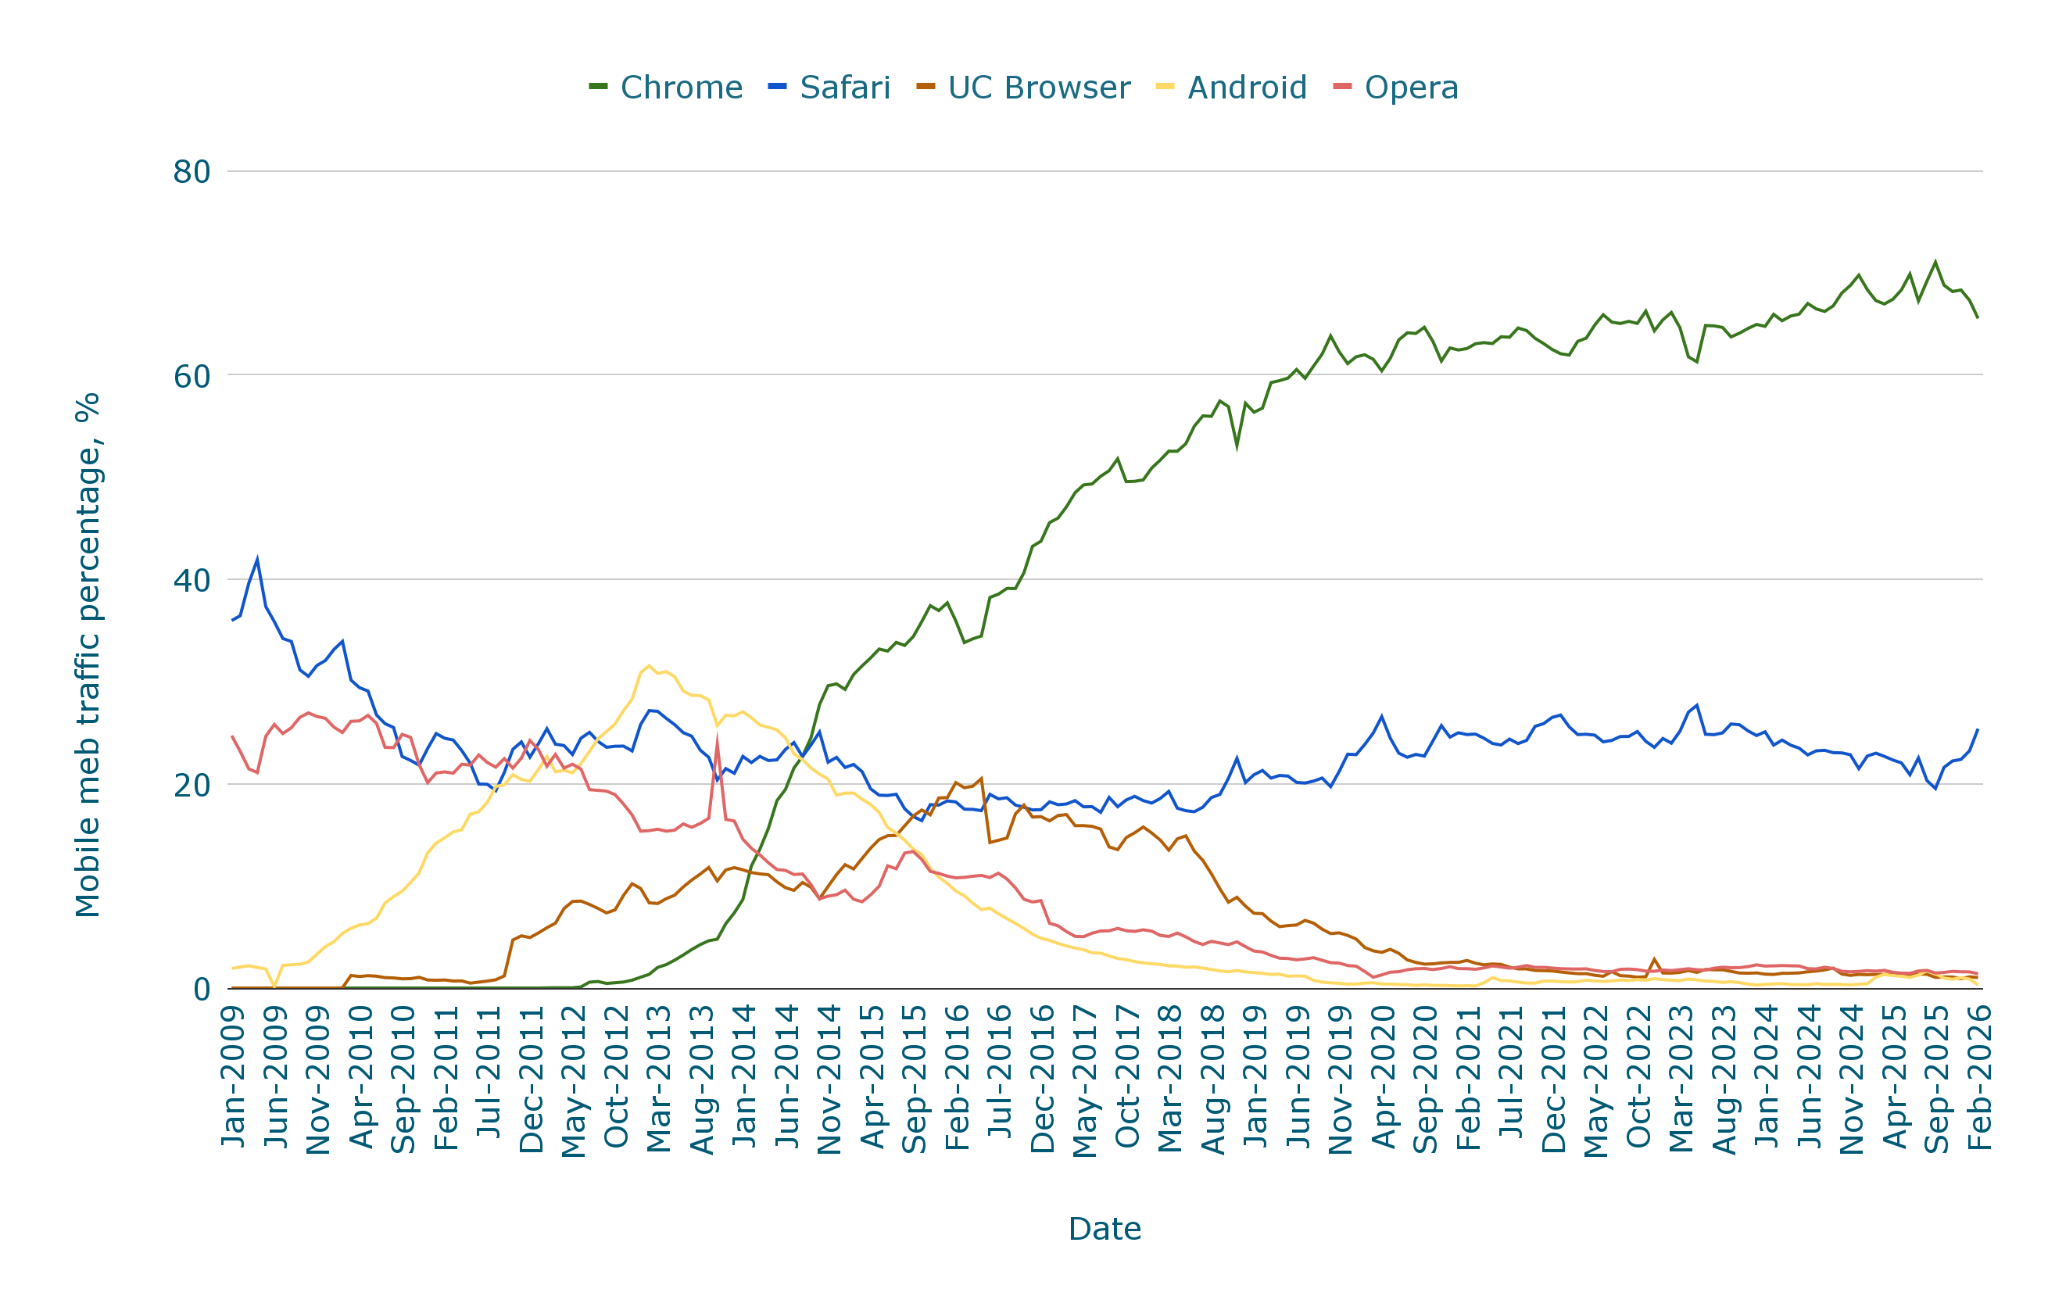
- Chrome’s mobile browser share increased from 0.00% in 2009 to 66.41% in 2026, becoming the dominant browser for mobile website traffic.
- Safari’s share declined from 35.04% in 2009 to 24.30% in 2026, despite remaining the second-largest mobile browser.
- Android Browser usage peaked at 29.01% in 2013 before falling sharply to 0.60% by 2026.
Mobile web traffic by browser worldwide
| Year | Chrome share, % | Safari share, % | US Browser share, % | Android share, % | Opera share, % |
| 2009 | 0.00% | 35.04% | 0.00% | 2.24% | 24.80% |
| 2010 | 0.00% | 26.99% | 0.87% | 8.05% | 24.48% |
| 2011 | 0.00% | 22.43% | 1.79% | 17.77% | 22.01% |
| 2012 | 0.31% | 23.95% | 7.72% | 23.62% | 20.38% |
| 2013 | 3.65% | 24.21% | 10.12% | 29.01% | 16.53% |
| 2014 | 20.28% | 22.96% | 10.41% | 23.46% | 11.32% |
| 2015 | 33.48% | 18.94% | 15.01% | 15.53% | 10.93% |
| 2016 | 38.21% | 17.95% | 17.53% | 7.41% | 10.22% |
| 2017 | 48.91% | 18.09% | 15.53% | 3.46% | 5.61% |
| 2018 | 54.37% | 18.87% | 12.06% | 1.95% | 4.73% |
| 2019 | 60.14% | 20.75% | 6.17% | 0.99% | 2.88% |
| 2020 | 62.56% | 24.01% | 3.17% | 0.35% | 1.72% |
| 2021 | 63.31% | 24.77% | 2.12% | 0.55% | 2.00% |
| 2022 | 64.38% | 24.75% | 1.44% | 0.72% | 1.77% |
| 2023 | 64.22% | 25.35% | 1.59% | 0.64% | 1.92% |
| 2024 | 66.71% | 23.33% | 1.50% | 0.37% | 1.95% |
| 2025 | 68.39% | 21.84% | 1.22% | 1.12% | 1.60% |
| 2026 | 66.41% | 24.30% | 1.07% | 0.60% | 1.49% |
The data show a clear consolidation of mobile web traffic around a small number of browsers over time. Chrome’s sustained growth contrasts with the gradual decline of legacy mobile browsers, indicating a shift toward standardized browsing environments. Overall, the browser distribution reflects broader website traffic trends, where a limited set of platforms now accounts for the majority of mobile internet traffic worldwide.
After examining how mobile website traffic is distributed across browsers, this section shifts focus to search behavior, which represents a related but distinct type of online activity.
Mobile share of Google searches worldwide (2011-2024)
The chart below shows the mobile share of Google searches from 2011 to 2024, expressed as a percentage of total searches performed on Google. This time series illustrates how search behavior has shifted alongside broader changes in mobile internet traffic and device usage.
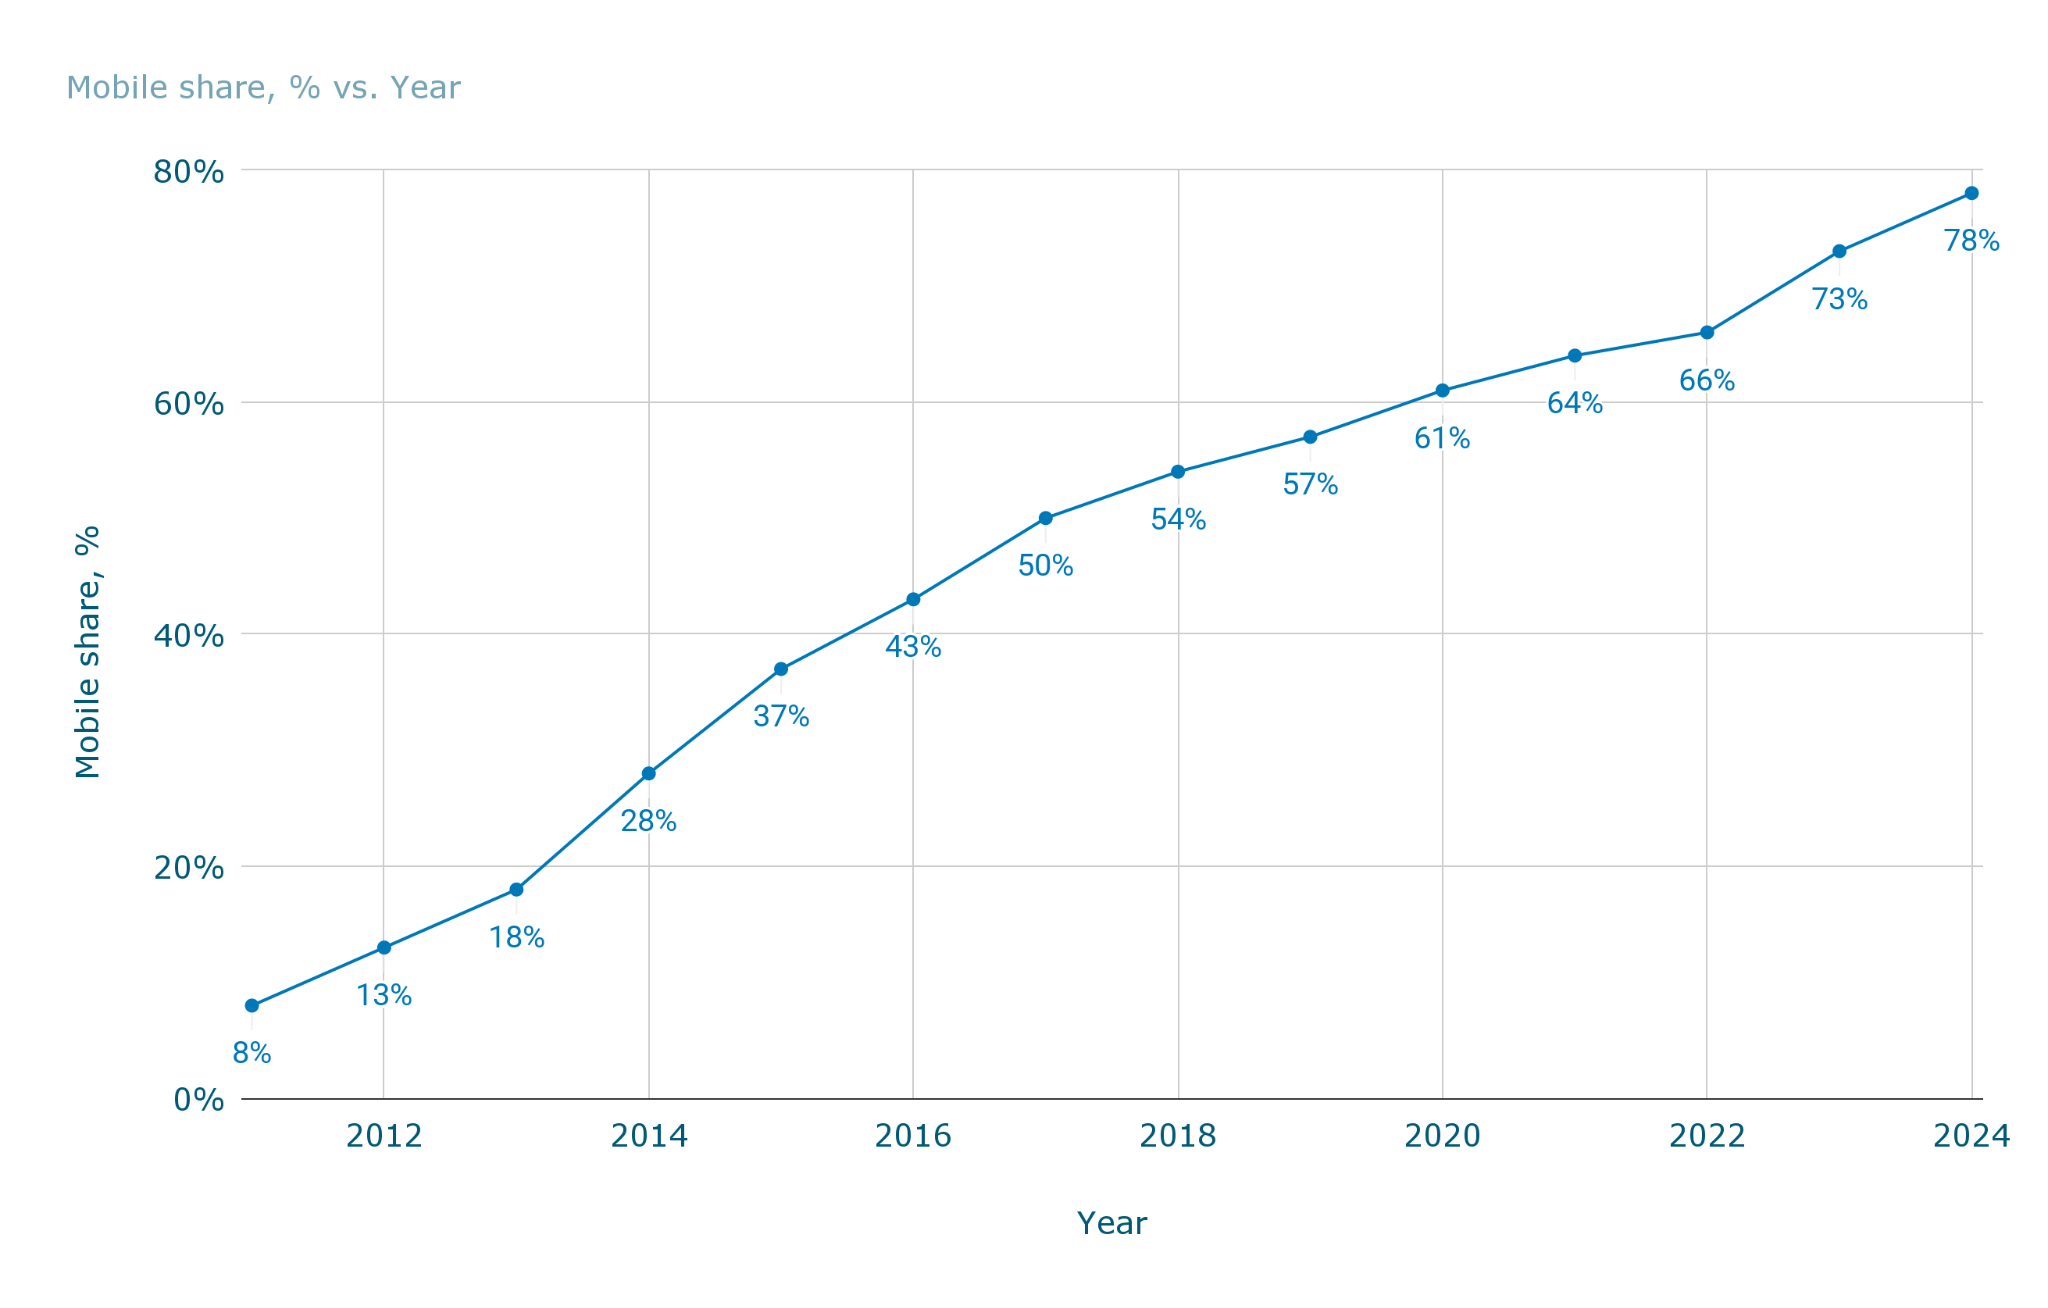
- The mobile share of Google searches worldwide increased from 8% in 2011 to 78% in 2024, a rise of 70 percentage points.
- Mobile searches reached parity with desktop in 2017, when 50% of Google searches were mobile.
- Growth continued steadily after 2017, with mobile search share rising from 54% in 2018 to 78% in 2024.
Percentage of Google searches from mobile devices over time
| Year | Mobile share, % |
| 2011 | 8% |
| 2012 | 13% |
| 2013 | 18% |
| 2014 | 28% |
| 2015 | 37% |
| 2016 | 43% |
| 2017 | 50% |
| 2018 | 54% |
| 2019 | 57% |
| 2020 | 61% |
| 2021 | 64% |
| 2022 | 66% |
| 2023 | 73% |
| 2024 | 78% |
The data indicate a long-term structural shift in search behavior, with mobile devices becoming the primary way users interact with Google. Compared with website usage, the mobile search market share crossed the 50% threshold earlier and has continued to widen its lead in subsequent years. Overall, these figures clarify what percentage of Google searches are mobile and show that mobile adoption in search has progressed more rapidly than in some other areas of web usage.
Conclusions
- Mobile devices now account for a majority of global website traffic, reaching 50.59% in January 2026, which confirms that mobile has become the primary access channel to the web worldwide. However, the narrow gap between mobile and desktop usage indicates that web traffic remains distributed across platforms rather than being fully mobile-dominated.
- Over the long term, mobile’s role in website traffic has expanded substantially, rising from 0.98% in 2009 to over 50% after 2017. While mobile usage continued to grow into the early 2020s, recent fluctuations, including a peak of 60.97% in 2024 followed by a decline, suggest that mobile adoption has entered a more mature phase characterized by year-to-year variability rather than uninterrupted growth.
- Geographic and industry-level differences remain pronounced. In 2025, mobile accounted for nearly four-fifths of website traffic in Africa, while remaining closer to parity with desktop in regions such as Europe and North America. Similarly, mobile usage is dominant in consumer-oriented industries like social media (80.0%) but significantly lower in B2B SaaS (34.7%), reflecting structural differences in how users interact with websites across contexts.
- The mobile ecosystem has also consolidated around a small number of platforms, with Chrome capturing 66.41% of mobile browser usage by 2026, while legacy mobile browsers declined sharply. In parallel, mobile search behavior has advanced even faster than website usage, with the mobile share of Google searches rising to 78% by 2024, indicating that search activity transitioned to mobile earlier and more decisively than general web browsing.
- Taken together, the data show that mobile traffic is not only a dominant component of today’s web but also a complex and unevenly distributed one. Understanding how much website traffic is mobile requires considering time, region, industry, and usage type, rather than relying on a single global percentage.
Sources
- “Desktop vs Mobile vs Tablet vs Console Market Share Worldwide | Statcounter Global Stats.” StatCounter Global Stats, 1 Jan. 2009, https://gs.statcounter.com/platform-market-share. Accessed 25 February 2026.
- https://www.businessofapps.com/data/google-statistics/. Accessed 25 February 2026.
- https://www.quantumrun.com/consulting/mobile-website-traffic/. Accessed 25 February 2026.
Was this article helpful to you?
 Yes
 No
VPS popular offers
-20.8%


 Windows
€ 100 /mo
Billed annually
-10%
 Linux
€ 41.91 /mo
Billed annually
-10.8%
Windows
€ 17 /mo
Billed annually
-10%


€ 55.54 /mo
Billed annually
-22.2%
Linux
€ 33 /mo
Billed annually
-10%
Windows
€ 28.99 /mo
Billed annually
-10%
Linux
€ 5.2 /mo
Billed annually
-10%
Linux
€ 21.42 /mo
Billed annually
-29.4%
Linux
€ 17 /mo
Billed annually
-21.5%
Windows
€ 40 /mo
Billed annually


